Inflation Is Down, But Not Out
Summary & Key Takeaways
Both headline and core inflation measures have made material progress to the downside in recent months.
Headline CPI should continue grinding lower in the short-term, but, any sustained rise in energy and food prices would likely see inflation pressures re-emerge, though this is far from guaranteed. Base effects have now also shifted from headwind to tailwind for energy and goods inflation.
Owner’s equivalent rent should begin to decline which will put continued downward pressure on core inflation. Though the pace of core CPI disinflation will ultimately depend on wage growth, which is likely to remain robust for at least the remainder of 2023.
Should we see headline inflation pressures accelerate as 2023 progresses, higher for longer monetary policy could end up being higher and for longer than even the most hawkish hawks expect.
Down Comes Inflation
Positive progress continues to be made on the inflation front. After peaking at 8.9% in June 2022, headline CPI has decelerated meaningfully this past year, with the June 2023 reading coming in at 3.1% putting it just 100 basis points above the Fed’s 2% target.
While core CPI has proved sticky, it has decelerated nearly two percentage points since peaking at 6.6% in September last year, while sticky prices CPI less food, energy and shelter has also declined meaningfully. Meanwhile, other measures that capture the sticky side of inflation such as the Fed’s preferred core PCE as well as the trimmed mean PCE price indices are both looking to be rolling over.

Inflation momentum is clearly to the downside across the board.

June’s inflation reading was particularly notable. For the first time in over 18 months, core CPI came in below the Fed’s 2% target on a MoM annualised basis (a target in which headline CPI has been fluctuating around for nearly 12 months). Services inflation has proved rather sticky in 2023, so June’s downside surprise is an encouraging step in the right direction.

On a headline basis, the biggest contributor to the recent disinflation has been energy prices, which have been outright deflationary since March. Food inflation has also continued is decent while good inflation has been almost immaterial since the turn of the year. Meanwhile, services ex-shelter CPI is also beginning to fall as wage growth itself is reaching its peak.

Shelter CPI also looks to be past its peak, which is important given it remains by far the largest component of both headline and core CPI. Shelter CPI (35% of headline CPI) is primarily made up of both rent CPI (7.5% of headline CPI) and owners’ equivalent rent CPI (25.5% of headline CPI).

Inflation breakevens have also continued their slow decent across the board, with 5-year, 10-year and 20-year breakevens all trading between 2-2.5% respectively.

While progress on the inflation front is clearly trending in the right direction, let’s not forget core inflation is still at 4.9%. The fight is far from done.
Is there more disinflation to come?
In terms of the outlook for inflation, the leading indicators continue to suggest the downtrend in both headline and core CPI should continue for at least the next couple of months.
Indeed, first and foremost, my composite inflation leading indicator - which tends to lead headline CPI by around four to six months - is suggesting exactly that. However, it is worth noting the downtrend in this leading indicator looks to be slowing. As I shall discuss in more detail shortly, this may be presaging another rise in inflationary pressures later this year (though it may still be too early to make such calls with certainty).

In terms of the business cycle, the ISM Manufacturing PMI has historically lead inflation by around nine months. Headline inflation in particular is heavily linked to the business cycle, and given inflation is the most lagging of all economic indicators, the recent decline in the PMI (a decline which should continue over the next quarter or two) is also suggesting the immediate outlook for inflation remains to the downside.


This is a message being confirmed by input prices for both manufacturing and non-manufacturing industries, with the ISM Manufacturing Prices Paid and ISM Services Prices Paid subcomponents of the ISM survey each generally leading headline CPI by around three months (though it is worth noting the slight uptick in the ISM Manufacturing Prices Paid series over the last month or two).


Of course, the fall in input costs for businesses highlighted above has primarily been a result of falling industrial commodities, which feeds through to things like the ISM survey as well as the producer price index (PPI). Both indicate further declines in inflation are likely over the short-term. These dynamics have been the primary driver of goods disinflation over the past year.


Likewise, one of the big contributors to goods inflation throughout 2021 and 2022 were supply chain bottlenecks. Supply chain pressures have of course eased significantly since, with the New York Fed’s Supply Chain Pressures Index having recently moved into negative territory, and tends to lead the CPI by around six months.

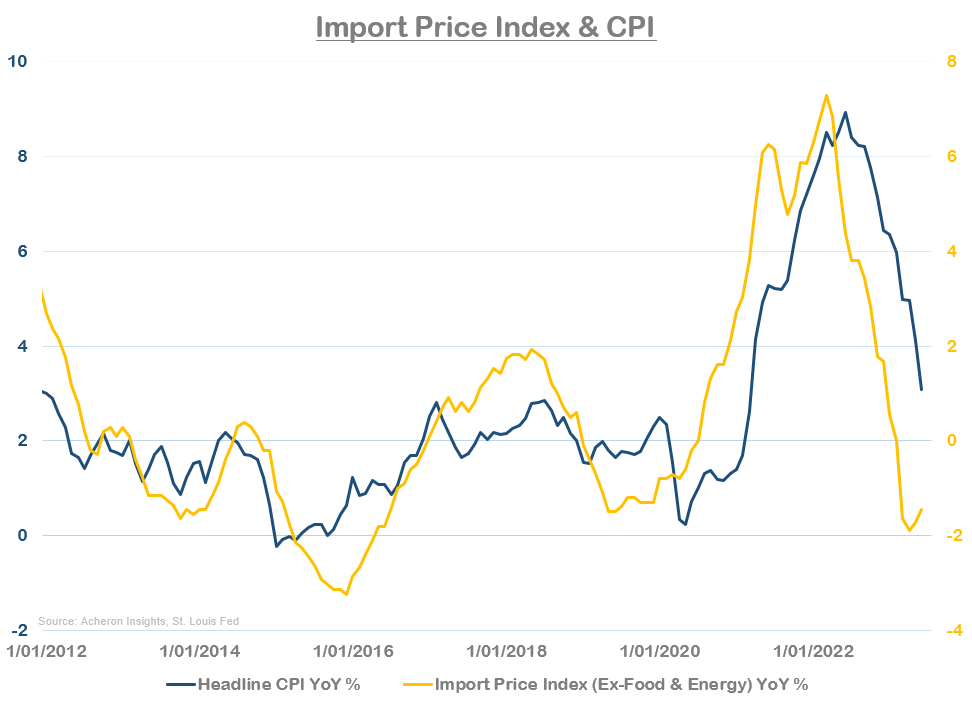
Of course, as supply chain pressures ease, import prices have fallen, again helping to drive down goods inflation.
Though only a small component of the BLS’ consumer price index basket (2.8%), used vehicle inflation was a big contributor to the spike in CPI during 2021. Used vehicle CPI is now outright deflationary (-5.2%) and looks as though it will stay there for at least another month or two.

While also suggesting new vehicles inflation (4.3% of the headline CPI basket) should continue to head lower for the time being.

Shifting our attention now towards food inflation (13% of headline CPI), good progress is again being made to the downside. The leading indicators suggest we ought to expect this to continue for some months still.
Indeed, food manufacturing PPI - which leads food CPI by around six months - is now in negative growth territory.

As is the FAO Food Price Index (a measure of global food prices), which itself leads food CPI by around eight months.

Ditto fertilizer prices.

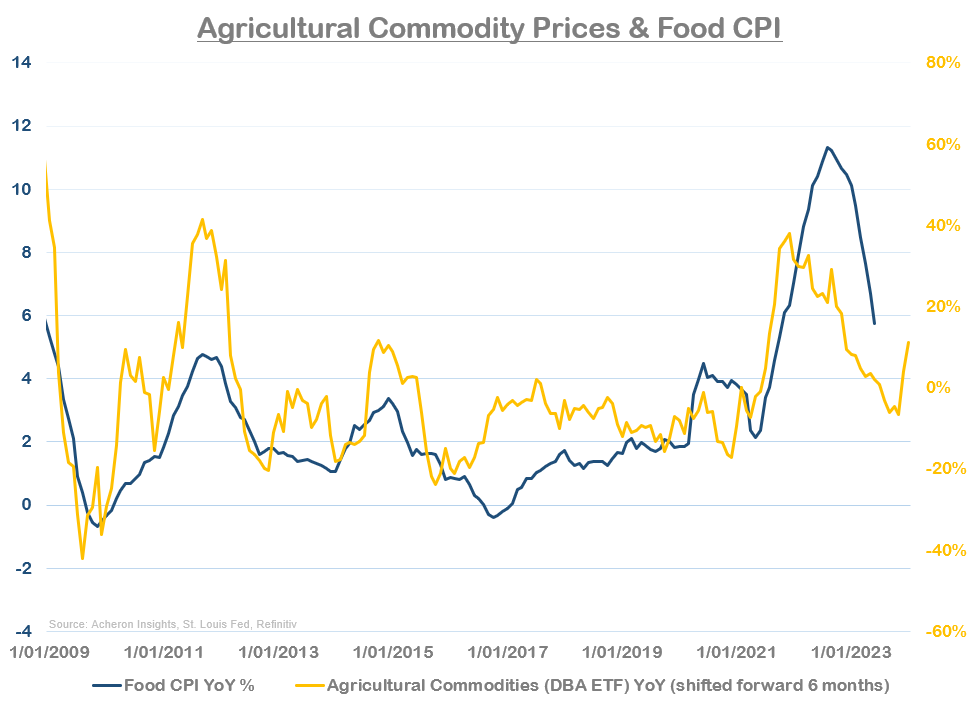
However, while these leading indicators of food inflation are all suggesting a significant decline in food CPI, how far down we actually see food inflation fall remains to be seen. Indeed, at the end of the day, food inflation is driver by food prices which are driven by the prices of agricultural commodities. And, as we can see below, agricultural commodities have moved higher of late (with the DBA ETF up around 18% off the January lows). Unless ag prices roll over hard from here (my models for many of the major grains remain neutral to bullish, so I am not willing to take that bet - for now), this trend has the potential to translate into a re-acceleration of food inflation later in the year.

When it comes to energy inflation (currently 6.9% of the headline CPI basket), the good news has likely run its course. Falling oil and gasoline prices have been a significant driver of the recent disinflation we have seen, and, while this may continue for another month or two, as a result of base effects alone energy prices will turn from inflation headwind to tailwind once again.


My base case is we will see moderately higher oil prices in the second half of 2023, and even if we don’t see $100 crude any time soon, this will translate into inflationary pressures that will likely put a floor under headline CPI in the second half of the year.
This could be particularly impactful for financial markets given the correlation for oil prices to things like inflation breakevens, as these and other measures of inflation expectations tend to be highly correlated to movements in energy prices.

So, for goods, energy and food inflation, the short-term outlook likely remains to the downside. But, as we look out a quarter or two, from base effects alone we could see some inflationary pressures re-emerge, though much of this will depend on how sustained any rally in energy and agricultural commodities proves to be.
On the services side of the equation (i.e. the primary inputs to core and sticky measurements of inflation), seems likely we should continue to see a general trend of disinflation for the foreseeable future, though the pace of services disinflation is less clear.
Beginning with the rent component (7.5% of the headline basket) of shelter CPI, the leading indicators of rental costs such as the Zillow Observed Rent Index (ZORI) suggest that rent CPI will rollover hard over the next six months.

But, with wages still strong, until we see wage growth subside materially (more on this shortly) it seems unlikely rent inflation will trend meaningfully lower in the immediate future.

The area of shelter CPI where it appears far more certain that disinflation will ensue in the more immediate term is owners’ equivalent rent (OER), which makes up 25.5% of headline CPI. OER is the primary directional driver of inflation over the medium-term. When it comes to OER, house price growth has historically led by around 12-18 months, and, should this relationship hold (which it seems to be doing thus far throughout this cycle), OER growth will move meaningfully lower over the next 12 months.

Given OER is the largest single component of both headline and core CPI, the kind of disinflationary outcome the movement in house prices suggests would go a long way to pushing core CPI in particularly toward the Fed’s 2% target throughout 2024.
But again, how much of a deceleration in core inflation we see will also be determined in part by the direction in wage growth, which is continuing to prove sticky.

And although wage growth has almost certainly peaked and is likely to head lower over time, we are yet to see any clear indication this will occur in the near future. My composite leading indicator for wage growth - which tends to lead wages by around six to nine months - remains stubbornly high. It looks like this may be a story for 2024, not 2023.

Though stubborn wage growth will likely slow the downtrend in core inflation, the outlook for owners’ equivalent rent should result in a slow and steady decline in core CPI and services inflation overall over the next year or so, regardless of what occurs with goods, food and energy CPI.
Summary & Implications
As it stands, the outlook for inflation remains fairly positive for the short-term. This is true of both headline and core CPI. While energy CPI has been the driving force of the decline in headline inflation thus far, energy prices look to have bottomed. Meanwhile, the recent bounce in food prices suggests the downtrend in food inflation may be nearing an end, and much alike energy prices, could a rally in the underlying commodities be sustained throughout 2H23, headline inflation could surprise people to the upside. Base effects are also heavily unfavourable for not only energy inflation, but goods inflation also. This has been a big driver of disinflation that is unlikely to continue much longer.
While not yet a certainty, any re-acceleration of food and energy prices could be detrimental to those hoping for any kind of dovish Fed pivot any time soon (let alone rate cuts), and could ultimately see the Fed not only hold rates higher for longer, but continue to hike much further than anyone expects.
Fortunately, the implications of higher energy and food prices won’t have any material impact on core CPI, which should continue to trend lower over the next year. A decline in owners’ equivalent rent should be the driver of this decline, but ultimately, until we see the outlook for wage growth subside materially (which has not yet occurred), how long it takes for core CPI to reach favourable levels remains to be seen.
. . .
Thanks for reading!
If you would like to support my work and continue to allow me to do what I love, feel free to buy me a coffee, which you can do here. It would be truly appreciated.
Regardless, feel free to share this with friends and around your network. Any and all exposure goes a long way and is very much appreciated. Thanks again.