Growth Outlook Improving, But Worst Is Yet To Come
Where are we in the business cycle?
The resilience of the US economy continues to be the story of the first half of 2023. While calls for recession have been abundant for nearly a year, the US economy continues to chug along. Q1 GDP growth came in at over 7% in nominal terms, while the Atlanta Fed is projecting Q2 GDP growth of over 2%. No recession yet.
Digging deeper, in assessing the current state of the business cycle we can turn to hard data points such as employment, industrial production, consumption and incomes, which provide a robust look at the trends in coincident growth from all areas of the economy and provide a timelier assessment of where we are in the business cycle compared to GDP.
Taken together, a composite model of these indicators shows that while the overall trend in growth is down (since peaking in mid-2021), growth remains repost and well above the average levels seen over the past decade.

If we assess the business cycle through the lens of the ISM Manufacturing PMI (a soft data input which provides an even timelier measures of growth than the Business Cycle Index above, which consists of hard data points) continues to prove a little less robust than what the hard data points suggest, with the PMI well into contractionary territory but not quite at levels akin to historical recessions.
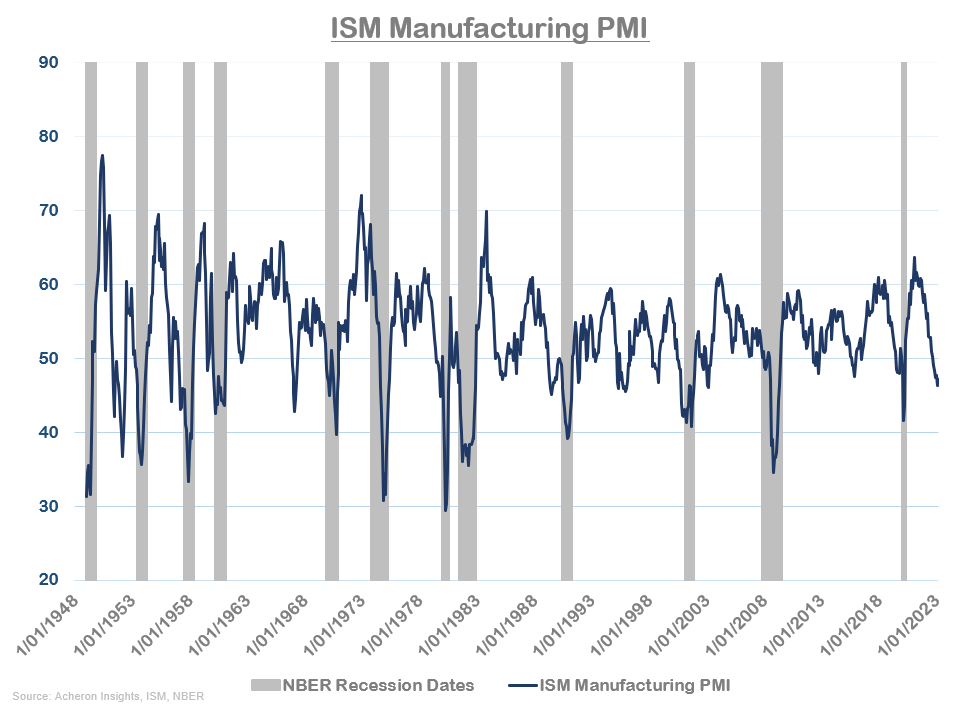
We will come back to the PMI shortly as this is perhaps the best indicator of the business cycle whilst also leading most hard data points by around three to four months.
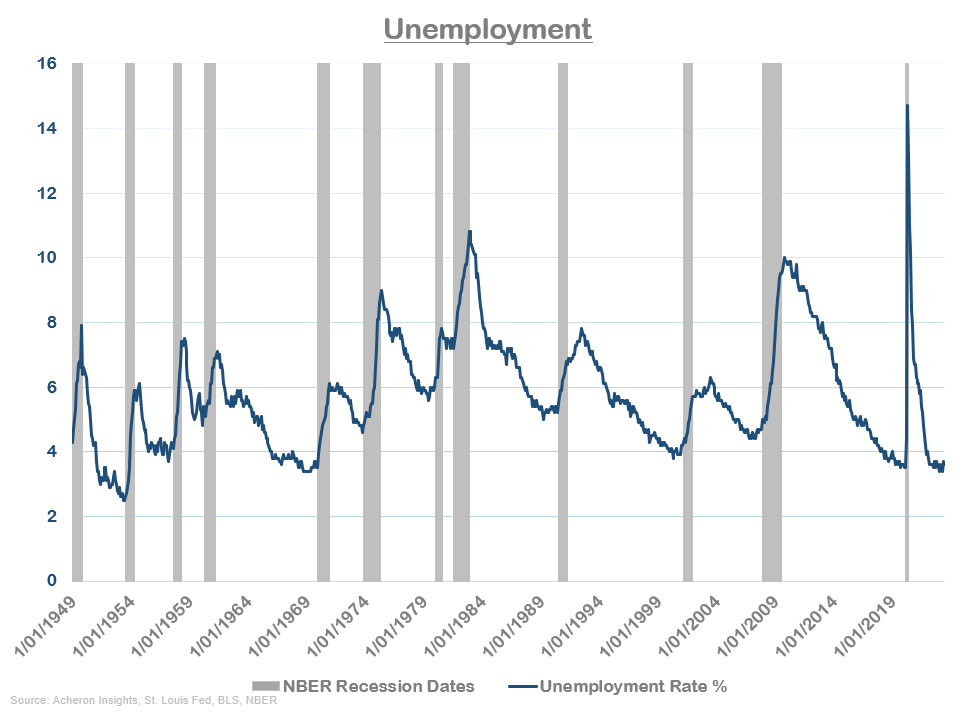
Continuing our journey through the current state of the economy, the unemployment rate remains floored at cyclical lows as the tightness within the labour market continues.
Meanwhile, the sixth month annualised growth rate of industrial production, real personal consumption, real incomes ex-transfer receipts and employment are all more of less trending in-line with their recent trends. For a recession and/or trough in the business cycle to be confirmed, we need to see these various indicators meaningfully decelerate to the downside.

Although we are seeing a bit of weakness in industrial production and manufacturing and trade sales, things like employment, incomes, consumption, retail sales and manufacturing new orders remain robust.


If we focus in on some of the major cyclical drivers of economic growth, the story is again quite similar. While things like housing investment and the total business inventories to sales ratio have been falling, vehicles sales and overall business investment growth have both rebounded in recent quarters.

This has come as a shock to many, with economic surprises in the US recently reaching its highest level since the post-COVID expansion. It must be said however that the “surprises” are likely overstated due to the poor outlook for the economy economic forecasters have had for some time now.

So, despite many of the leading indicators of the business cycle having turned materially negative for some time now, the US economy continues to prove resilient, even in some of the more cyclical areas of the economy.
There are a number of reasons as to why this is, many of which are centered around the idea that the average consumer is simply not as exposed to interest rates as many thought they would be. Overall, the strength in the US economy can be attributed to a confluence of the following:
Strong household and corporate balance sheets;
Limited consumer exposure to interest rates and tightening credit conditions (particularly given the fixed nature of most US mortgages);
Limited exposure of the US economy to the cyclical manufacturing sector;
Strong and persistent wage growth; and,
The success and residual effects of fiscal stimulus.
Perhaps the most important of these dynamics has been the strength of the household balance sheet, with the average household being in their strongest financial position in decades (I will cover this is greater detail below). Elsewhere, the services side of the economy is also still running hot.
This latter point is important as the US economy is a services driven economy, with the services sector being responsible for roughly 80% of all job creation and over 60% of GDP. Although the manufacturing sector is a large driver of the cyclicality of the business cycle, the dynamics within the services sector are what define the overall trend in economic activity. Services consumption growth is still significantly higher than any level seen in recent decades.

Now, I say all that to say this. Hard economic data is lagging economic data. What I have presented thus far is simply a summary of the economic trends seen over the past few months. Coincident economic data defines the trend, but it does not tell us which direction the trend is heading. For that, we must turn to the leading indicators of the economy, to which I will start with the leading indicators of the hard economic data points we have reviewed thus far.
Expect hard data to deteriorate
As has been the case for a while now, the leading indicators of the business cycle suggest we are going to see a deterioration in hard data over the coming quarters. Whether or not this is enough to send the economy into recession remains to be seen, but I expect some kind of deteriorate to eventuate nonetheless - particularly as some of the drivers of economic resilience run their course.
Firstly, my hard data leading index - which combines a number of leading economic indicators such as the yield curve, building permits, ISM new orders among others - has been negative for quite a few months now. This leading indicator tends to lead the major hard economic data points by around six months, but given the abnormal strength of households this cycle, the lag is most likely longer. Nonetheless, it suggests a deterioration in things like industrial production, consumption, income and employment is likely in the second half of 2023 and early 2024.

Lending standards are suggesting something similar. As credit conditions tighten and banks become increasingly stringent with whom they are willing to lend, spending and economic activity overall tends to falter. This is particularly the case for commercial and industrial loans as well as credit card loans, and as these credit conditions tighten, industrial production and retail sales growth tend to contract on roughly a three-month lag.


Meanwhile, household net worth as a percentage of GDP has long provided an excellent short-term lead on GDP growth given the importance of the wealth effect within the US. This indicator suggests negative GDP growth is likely to materialise at some point in the near future. I suspect this won’t occur until Q4 at the earliest.

And of course, the best leading indicator of hard data (and the timeliest indicator of the business cycle itself) is the ISM Manufacturing PMI, which tends to lead my business cycle index by around three months. Again, the message here is a strong deterioration in hard data is likely in the next two to three quarters.

Herein lies the importance of understanding the sequencing of the business cycle. While the PMI is a leading indicator of hard data, it is not a leading indicator of the business cycle itself, but again is perhaps the timeliest representation of the business cycle.
The hard economic data points by the likes of industrial production, employment, incomes, consumption and inflation are lagging data, all of which lag the PMI by around three to 12 months.

On the other hand, indicators such as financial conditions, ISM survey subcomponents, policy rates, food and energy prices as well as residential investment are all leading indicators of the PMI itself. Some indicators lead the PMI by up to two years (such as manufacturing and commodity prices), while others have lead times as little as three months (the ISM New Orders less Inventories spread for example). Understanding where the PMI is and where it is heading is the most important aspect to business cycle analysis and investing. The PMI is the most up to date representation of the business cycle, it leads hard economic data and its movements are most closely related to asset prices.
We are nearing a bottom in the PMI
Fortunately, as we look out to where the business cycle is heading in 2024, the news is becoming more positive by the month. Many of the longer leading indicators of the PMI have long since bottomed and are forecasting an exceptional pick-up in growth for next year. While we aren’t there yet, this is an encouraging outcome.
Starting with the longer leading indicators of the PMI, my financial conditions index - which consists of changes in the dollar, interest rates and oil prices - is an excellent barometer for both future economic performance as well as corporate earnings. This index tends to lead the ISM by around 18 months (give or take three months), and suggests the ISM will likely bottom out at some point this year before a swift upturn in 2024.

Food and energy prices, as well as commodity and manufacturing PPI are also sending a very similar message. We ought to expect a bottoming of the PMI at some stage in the next couple of quarters following by a rebound in 2024.


The ISM Manufacturing Prices Paid survey is also sending a very similar message, with a lead of around 12 months versus the PMI.

When it comes to interest rates and monetary conditions, indicators such as the two-year changes in bond yields and mortgage rates are a little less constructive. Interest costs tend to lead the business cycle by around 15 months, and while rates look to have peaked (inverted below), the negative growth implications associated with tighter financial conditions could continue still.


In terms of monetary conditions however, it is likely we have reached peak hawkishness globally and this should bode well for growth come 2024. A diffusion index of the G20 central banks and whether they are raising or cutting policy rates on average tends to provide a 12-month lead on the business cycle and suggests the PMI may still head further south in the near future before beginning the next expansionary phase.

Indeed, given the long and variable lags on monetary policy, it is most likely the negative implications of the swiftest hiking cycle in decades are yet to play out. As we can see below via the work of TD Securities, it has historically taken around four quarters for rate hikes to have their maximum impact on GDP and about six quarters to fully impact inflation, meaning we are still only feeling the effects of mid-2022 policy rates. This doesn’t bode well for growth in the short-term given the significant number of rate hikes that occurred in the second half of 2022 and first half of 2023.

Source: TD Securities
I expect the implications of such tightening to play out via the credit cycle at some stage later in 2023 and into early 2024, and is one of the primary reasons I remain neutral to underweight broad equities and risk assets on a short to medium-term basis.
Turning now to the inventory cycle, it seems as though much of the growth headwind that resulted from the build-up of inventories in 2020 and 2021 has run its course. This bull-whip effect should again be a tailwind to growth come 2024 as manufacturers once again look to re-stock inventories.

The housing cycle on the other hand also remains a cyclical headwind for now, but should also become a tailwind for growth next year.

While we are yet to see housing investment pick-up materially in the data, the housing market itself continues to prove far stronger than many expected. Although I have been expecting house prices to correct somewhat, I have previously noted the structural undersupply of housing and the strength of household balance sheets should put a floor under house prices, but I did not expect to see the sort of resilience within the market that has indeed come to pass.
It seems the structural shortage in supply has far outweighed the rising mortgage costs, and existing home owners have decided to stop selling their homes in order to retain their existing cheap fixed mortgage rates (there were just 1.08 million homes for sale last month compared to 1.92 million in June 2019, according to the NAR). As such, estimates for Q2 and Q3 residential investment have turned positive (0.1% for Q2 according to the Atlanta Fed’s GDP Nowcast model, which would be the first quarter of positive growth since Q2 2021), so it is likely we will see an uptick in this leading indicator moving forward. Housing - one of the primary cyclical drivers of the business cycle - should once again become a significant tailwind for growth as we enter 2024.

Source: Wall Street Journal
So far, the rate-of-change in building permits is corroborating this message.

Meanwhile, the ISM New Orders less Inventories spread - which tends to provide a fairly reliable three-to-four-month lead on the PMI itself - looks like it could be in the process of bottoming, and as such the PMI itself could find a bottom over the next quarter.

Taken together, these various leading indicators of the ISM Manufacturing PMI suggest the business cycle is most likely going to bottom over the next couple of quarters before a rebound in growth ensues throughout 2024.
Whether we see a recession or not during this cycle remains to be seen. If we take the yield curve for example, of which the 2yr/10yr and 3m/10yr iterations both inverted in July and October last year respectively, it generally takes around 15-17 months from inversion until recession hits, which points to the Q4 2023 to Q1 2024 period. But, one dynamic we need to see first is a re-steepening of the yield curve, something that also generally occurs prior to recession. This is yet to occur.

Consumer confidence however seems to be picking-up off the lows. Whether this is confirming the trough in the business cycle is near or is just a reflection of the recent rally in risk-assts remains to be seen, but is an important consideration nonetheless.


Small business sentiment on the other hand remains near cycle lows.

While the Conference Board’s Leading Economic Index is also very close to recessionary territory.

Expect economic resilience to continue for a little while longer
An important determinant as to whether we do see a material decline in hard economic data as the leading indicators suggest or whether economic robustness continues is the strength in households and consumers.
As a result of the combination of fiscal policy and asset price boom over the past few years, households find themselves in their strongest financial position in decades. And, as previously stated, this is one of the primary reasons why the US economy is proving to be less interest rate sensitive and far more resilient than many expect.
Indeed, if we look at debt serviceability of households (measuring debt service payments as a percent of disposable income), mortgage debt costs remain near multi-decade lows (despite a historic rise in mortgage rates) while consumer debt burdens are sitting around their four-decade average.

The same can be said of total debt levels, of which only consumer debt is looking stretched relative to recent history.

While household net worth and checkable deposits are both still well above their long-term trends (particularly so for the latter).

All told, consumers and households are doing fine, and as a result, tighter financial conditions and higher costs are having a much smaller impact than they might have had otherwise.
However, it must be said we are starting to see cracks form within the realm of consumer debt, and in particular, credit card debt. In the wake of negative real income growth for much of 2022 (as inflation growth exceeded wage growth), we saw a material pick-up in credit card usage. Unfortunately for consumers, this period has also seen interest rates associated with credit card debt spike. As a result, credit card delinquencies are starting to pick up for small banks (who likely charge higher rates compared to the better capitalised larger banks).


We are also starting to see a slight uptick in the rejection rate for credit applications, most notably for credit cards and auto loans. What’s more, consumers’ expectations of future credit application rejections are beginning to spike to multi-year highs across the board.


While we are far from crisis levels and credit card delinquencies overall remain at average levels (as of Q1 2023), it is important to remember the US is a consumer driven economy. So, for a recession to occur, we would need to see the consumer really start of suffer, and how much they do will likely determine whether we end up seeing an outright recession or just a cyclical slowdown.
Another reasons for past economic resilience that will soon begin to constrain consumers is the re-commencement of student debt payments later this year. For the most part, millions of US households have not been required to make their regular student debt repayments over the past three years, of which Wells Fargo estimates their resumption will be the “equivalent to a pay cut of about 4% to 5% off U.S. median household income before taxes.” Given the majority of student debt is held by consumers who are generally in the high consumption age bracket, one would expect to see this to have an impact on economic activity.
What is the market pricing in?
While the outlook for the economy and business cycle is all well and good in isolation, as investors, the key consideration associated with such analysis is how it relates to financial assets and what markets are pricing in.
In terms of the stock market, equities priced in the poor outlook for growth rather well during 2022. As it stands, the subsequent rally seen over the past six to nine months suggests equities have now priced in much of the pick-up in growth that the leading indicators suggest will occur in 2024. The stock market is looking increasingly priced to perfection at current levels, so from a growth perspective stocks are looking somewhat vulnerable.

Again, the same can be said for the high-beta and cyclical areas of the market, with the cyclicals vs defensives ratio and high-beta versus low-beta ratio both looking to have already priced in much of any rebound of growth expected in 2024.


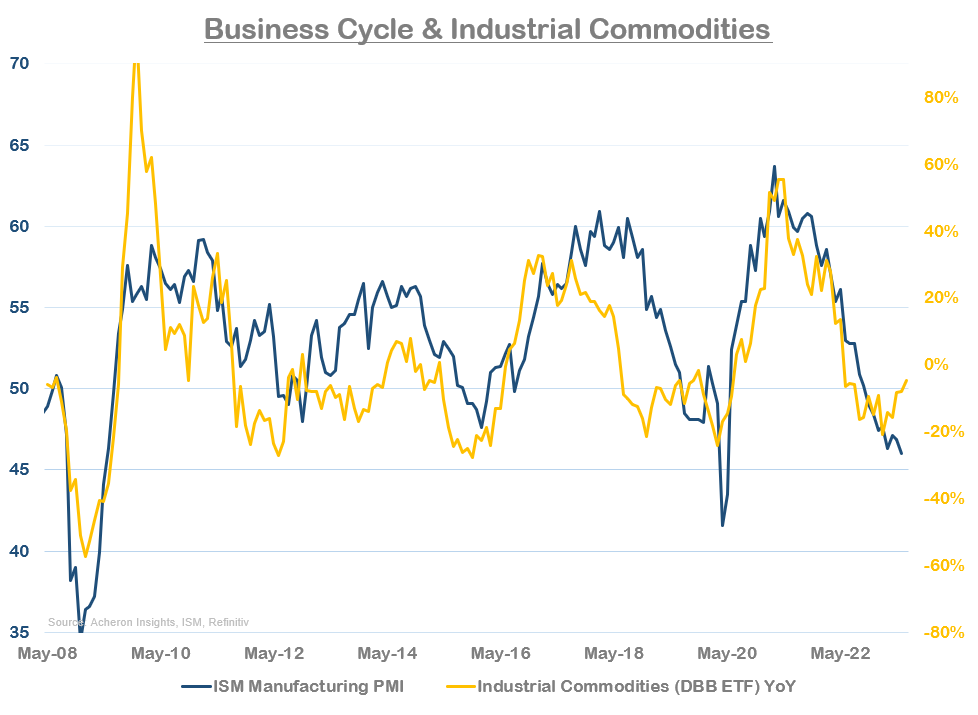
In terms of industrial commodities (which are primarily demand driven and track the business cycle closely), they are trading very much in-line with the movements in the PMI. Should the PMI have further still to fall in the coming months, it is likely industrial commodities that are heavily linked to manufacturing and economic growth may have further downside ahead.
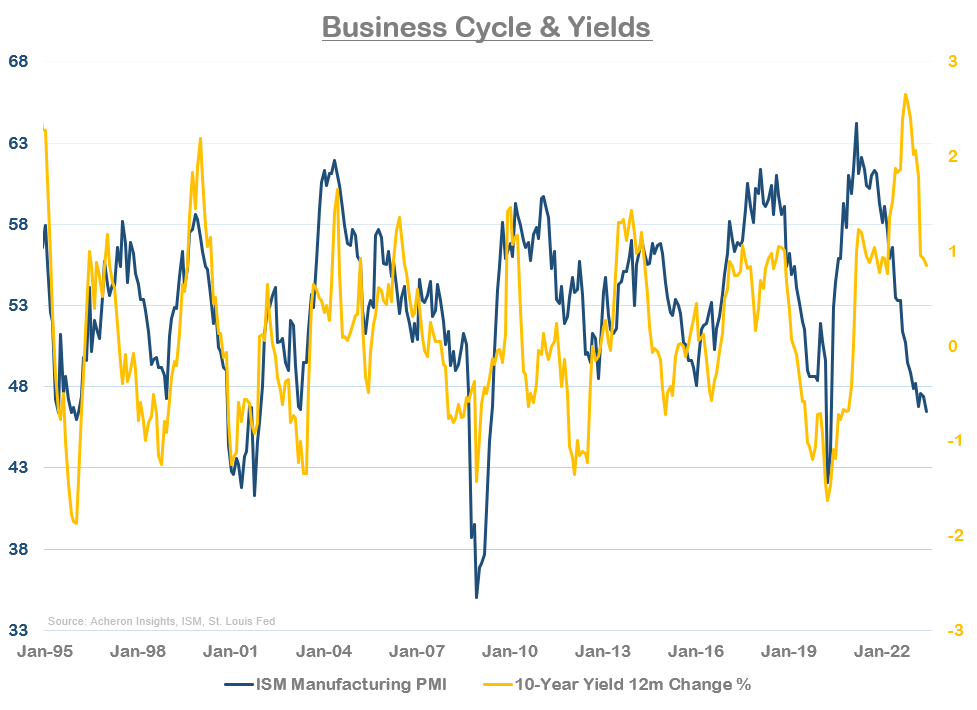
On the other hand, the relationship between yields and the business cycle that has held up so well in recent decades continues to diverge. While I believe we will see some kind of cyclical rally in yields should growth slow materially (particularly if we do enter recession), the secular headwinds for bonds are significant and put us in a very different environment for rates compared to past economic slowdowns.
The most vulnerable area of the market from a business cycle perspective continues to be the credit markets. Given my outlook for the credit cycle, the credit sector as a whole looks most mispriced from economic reality.


Summary & Key Takeaways
Economic resilience has continued through the first half of 2023, primarily driven by strong household balance sheets, strong wage growth.
The leading indicators of coincident and lagging economic data suggest we should see hard data points like industrial production, employment, incomes and consumption decline later in 2023 and 2024. Whether this decline is sufficient to induce a recession depends on how impactful the deterioration in credit availability is to the real economy - particularly consumers.
The ISM Manufacturing PMI - which leads most hard data by at least three to four months - should bottom around Q3-Q4, with the long leading indicators of the PMI suggesting a strong rebound in growth throughout 2024. The caveat to how broad of an economic recovery this is likely depends on how long monetary policy remains restrictive and whether we see a material pick-up in residential investment (which looks likely).
Broad equities look to have already priced in most of the projected rebound in growth for 2024, meaning most risk assets look vulnerable to the downside from a growth perspective (credit in particular).
. . .
Thanks for reading!
If you would like to support my work and continue to allow me to do what I love, feel free to buy me a coffee, which you can do here. It would be truly appreciated.
Regardless, feel free to share this with friends and around your network. Any and all exposure goes a long way and is very much appreciated. Thanks again.