The Outlook For The US Economy Is Bullish
Summary & Key Takeaways:
Hard economic data is likely past its trough, and should continue to accelerate as we progress through 2024.
We are still in the early stages of the next expansionary phase in the business cycle. The lead indicators of the business cycle suggest we should continue to see growth accelerate over the next 12 months.
These economic growth conditions should continue to be supportive of risk assets, though investors should keep in mind long-duration sectors such as tech and semiconductors have largely priced in the entire upswing in the business cycle.
However, commodities and cyclical sectors appear to offer the best risk-reward moving forward, given they stand to benefit from a pick-up in economic activity and have priced in little of the forthcoming expansionary phase of the cycle.
The economy has likely bottomed
My business cycle analysis has been suggesting for some time hard economic data should have bottomed throughout 2023, while economic activity should start to accelerate to the upside as we progress through 2024. There is an increasing amount of evidence suggesting this is the case, thus it appears the business cycle is past its trough and should continue to rebound throughout 2024.
Let’s begin our review of the current state of the business cycle by reviewing the primary hard economic data points that define the cyclicality in economic growth. While this is a useful exercise, we must keep in mind hard economic data (such as industrial production, employment, GDP etc) are all coincident and lagging in nature. They are all reported on a lag and tell us where the economy was two to three months ago, not where it is currently nor where it is heading.
So, with that in mind, the below chart illustrates my Business Cycle Index, which is a composite of the primary hard economic data points used by the NBER to track the business cycle, and includes industrial production, real personal consumption expenditures, real incomes excluding government transfers and employment. As we can see below, this composite of hard economic data looks to have bottomed out in late 2022/early 2023, the point which seemingly marked the trough for this cycle.

We can see this more clearly when viewing this Business Cycle Index on a six-month annualised growth rate basis. On the whole, the economy has been re-accelerating over the past six to 12 months.

Confirming this trend in hard economic data is the Conference Board’s Coincident Growth Index, which includes a similar but not identical composite of hard economic data points. The Conference Board Coincident Index also bottomed around six months ago.

Digging a little deeper into the underlying economic data itself, we can see below how consumption, incomes and employment look to be stabilising and forming a bottom, with industrial production the primary detractor from economic growth in recent months. While all data points remain below their recent trends, none look to be screaming recession at present.

If we turn our attention to the manufacturing sector (one of the primary drivers of the cyclicality of the business cycle), hard data from the manufacturing sector again looks to be confirming we are past the trough in this cycle. Manufacturing production, capacity utilisation and employment growth all look to be past their bottom. A pick-up in manufacturing new orders would seemingly be confirmation a new upturn in the manufacturing cycle is underway.

If we look at soft economic data from the manufacturing sector, which is generally much timelier than the hard data above, we can see clearly how the trough in the manufacturing cycle looks to have occurred around the first quarter of 2023. The ISM survey’s new orders, production and prices paid components are all signalling the upturn in the manufacturing cycle, which we should expect to show up in hard economic data over the coming quarter.

On the services front (the lagging of all lagging economic data), we are seeing some evidence suggesting we are past the trough in the services side of the economy. As we can see below, both services consumption and employment look to have past their bottom, while the services PMI exited its downtrend nearly 12 months ago. Wage growth on the other hard (which lags the business cycle by around 12 months) should be expected to continue trending downwards to sideways for some months still, as is common in the early stages of an economic expansion. For reference, I detailed the outlook for employment and wages in great detail here.

And finally, consumer activity also looks to be past its trough. Consumption and retail sales have both stabilised, so too has disposable income.

The outlook for hard economic data continues to improve
In we turn our attention to the outlook for hard economic data, we can see almost all the indicators which lead hard data by around three to six months have turned up significantly, suggesting there is likely to be an upside acceleration in these lagging data points as we progress through the second quarter of 2024.
Firstly, bank lending standards for commercial and industrial loans have eased materially over the past two quarters, suggesting industrial production should begin to pick-up over the next three months.

The same can be said of lending standards for credit card loans, which have also begun to ease. Credit card lending standards leads retails sales by around three months. Importantly, lending standards themselves should continue to ease as economic growth accelerates, as lending standards tend to lag business cycle indicators such as the ISM Manufacturing PMI (as we shall see shortly).

Household net worth is also suggesting GDP growth is likely to bottom around Q4 2023 to Q1 2024.

Could Q1 GDP come in lower? Sure. But with the Atlanta Fed Nowcasting robust real GDP growth for Q1 and inflation proving sticky, I don’t see GDP growth moving notably lower given what the lead indicators of hard data are suggesting for Q1/Q2.
Indeed, the Conference Board’s Leading Economic Indicator is another short-term leading indicator of hard economic data which has inflected higher of the past six to 12 months. This index tends to lead my Business Cycle Index by around three months.

And finally, what is perhaps the best and most timely representation of the business cycle is the ISM Manufacturing PMI. The PMI leads industrial production by around three months.

As it does my Business Cycle Index.

And of course, it also leads GDP growth by around a quarter.

The PMI and other short-term leading indicators of hard economic data are very much suggesting we should see a pick-up in coincident and lagging data as we process through Q2 and Q3 of 2024. They are also suggesting nominal GDP is likely to trough at a much higher level than anything we have seen over recent decades, a dynamic which to me highlights the power of fiscal stimulus and its impact on economic growth.
Where are we in the business cycle?
Understanding the leads and lags of economic data is imperative in assessing where we currently reside within the business cycle and where we are heading. Almost every data point I have presented thus far is a lagging economic indicator, at least when compared to the ISM Manufacturing PMI, which is the most timely and useful representation of the business cycle.
The following chart illustrates the sequencing of the business cycle, from hard economic data points as well as leading indicators and the extent to which they generally lead and lag the PMI.

This process also allows us determine at which stage of the cycle we currently reside. In doing so, we are afforded a power asset allocation tool and assets us in determining how financial markets and asset prices are likely to behave.
As we can see below, key economic data points were suggesting around the middle of 2021 was the peak in the previous cycle, while the trough looks to have been around late-2022 to late-2023, something to which the hard economic data presented above is now confirming. As it stands, we are still relatively early in the new expansion phase of the business cycle.

Remember, everything is linked to the business cycle. Global trade, global growth, industrial production, retail sales, capex, bank lending, employment and inflation are key examples of this. So, if we understand where the PMI is heading, we can glean an understanding of the consequences of an expansion or contraction in the business cycle. Everything is driven by the business cycle.

As investors we must live in the future, and looking at the leading indicators of the PMI allow us to do exactly that. While lagging economic data such as inflation, employment and GDP are all useful from a monetary policy perspective (as this data is what instructs monetary policy), it is not useful in assessing where the business cycle is heading nor is it useful from an asset allocation perspective. For that, we must refer to the leading indicators of the business cycle.
Leading indicators: A very bullish outlook
As I detailed in my previous outlook for the business cycle late last year, the long lead indicators were painting a bright picture for 2024. Nothing has changed on that front. Though what has changed in the months since are the shorter lead indicators, which now are almost unanimously pointing to a material pick-up in the business cycle in 2024.
Below we have the ECRI Weekly Leading Index versus the PMI, of which the former leads the latter by around two to three months.

The ISM Manufacturing New Orders/Inventories spread also continues to trend higher. This indicator leads the PMI by around three months.

My PMI momentum index also suggests we should expect to see upward movement in the PMI over the next four months.

The Conference Board’s CEO Confidence Index is also pointing to a higher PMI over the next six months.

As is global growth, which is measured below via a diffusion index of the OECD Leading Indicators for the world’s major economies.

Not only is this suggesting a pick-up in the US business cycle, but the global business cycle too. As the worlds primary consumer, it is important to remember how the US is the driver of the global business cycle, hence the close relationship between the two.

It is also important to note China no longer appears to the be the drag on global growth it has been in recent times. The China credit impulse tends to lead the US and global business cycle by around six to 12 months.


While China may not give the boost to global growth it has in previous cycles (as we are yet to see the China credit impulse move materially higher), it is certainly no longer a drag on global growth it has been as the Chinese economy slowly recovers from what appears to be a balance sheet recession.
The same dynamic can be said of global liquidity, which tends to lead the business cycle by around six months. Global liquidity has been trending higher over the past 18 months, but not materially so.

However, it is absolutely the case global monetary policy conditions look to be supportive of growth as the world’s central banks transition to a more dovish monetary policy regime. My Central Bank Policy Index tends to lead the business cycle by around a year, and is suggesting the US PMI should continue rising through the rest of 2024.

Ditto the global PMI.

The same can be said of financial conditions, which tend to lead the PMI by around six months.

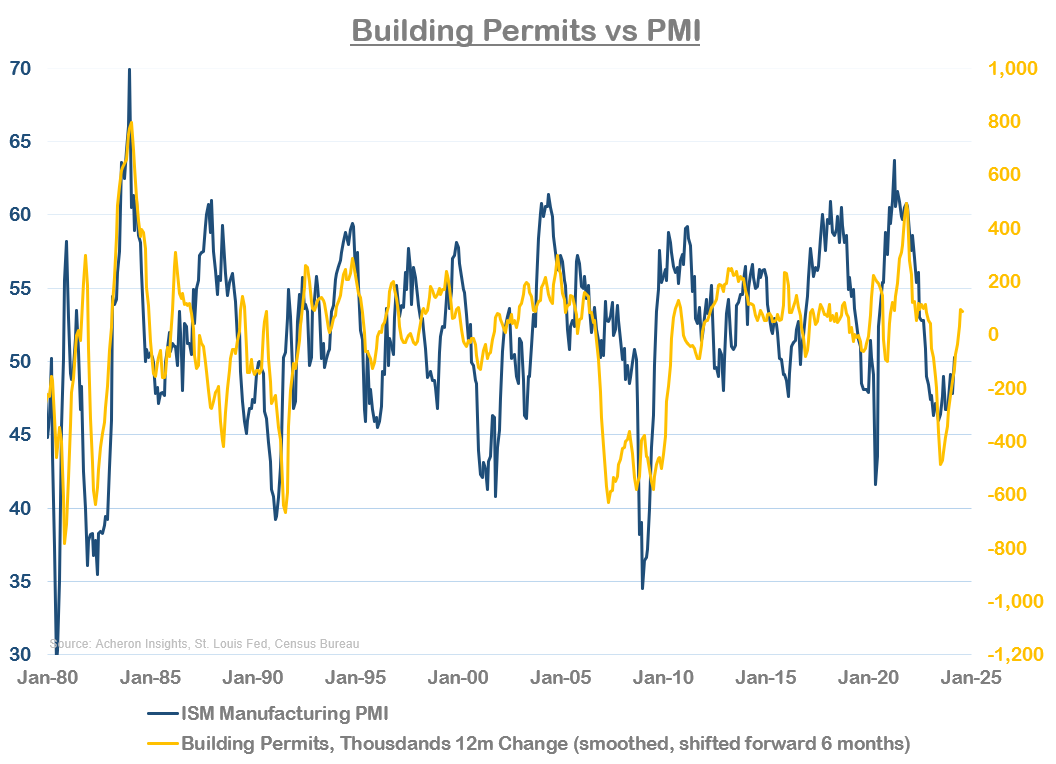
An important cyclical driver of the business cycle which we are also now seeing a positive growth impulse from is the housing market. Building permits tend to lead the PMI by around six months.
Residential investment - 10-month lead versus the PMI - also continues to slowly inflect higher.
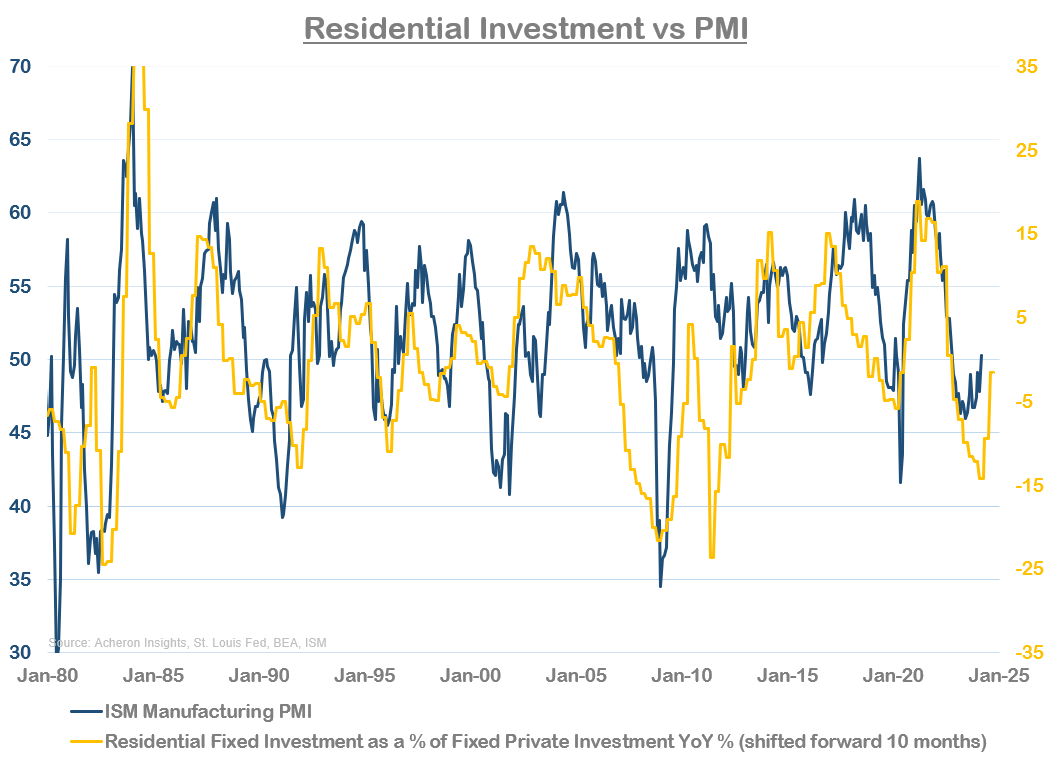
How long this expansionary stage of the business cycle lasts will be determined in large part by the housing market. Unless these housing market lead indicators continue to inflect higher, it is difficult to see the PMI move much higher than the 55 region. Thus, I will be keeping a keen eye on where these lead indicators trend over the coming quarters as this will assist greatly in assessing how long this expansionary phase can last.
One area of the economy that should be highly supportive of growth are manufacturing inventories. Higher inventories imply weaker future growth while lower inventories allow for greater future growth as inventories are re-built. As such, ISM Manufacturing Inventories tends to lead the PMI by around 15 months in an inverse fashion and is pointing to a material uptick in the PMI in 2024.

Borrowing costs also continue to become less restrictive for growth.

So are food and energy costs, which tend to lead the business cycle by around 12-18 months.

Ditto ISM prices paid.

Manufacturing input costs are suggesting the PMI should move notably higher this year.

Overall, my Macro Conditions Index is suggesting the PMI will continue to trend higher as we progress through 2024.

As does my Composite Leading Index, which leads the PMI by around 12 months.

And finally, we must remember the business cycle is inherently cyclical. This cyclical nature of the business cycle implies the business cycle itself can be a reliable indicator of where the cycle is heading over the coming year. Thus, the PMI tends to lead the PMI by around 12-18 months.

As we can see, we are likely to see a continued expansion in the US and global business cycles as we progress through 2024.
Asset allocation: Growth outlook supportive of risk assets
The expansionary phase of the business cycle is undoubtedly the most favourable period for risk assets. Thus, the recent strength in economic data and bullish outlook for the business cycle goes a long way to explain the recent strength in the stock market and commodities.
When growth is at a trough and accelerating, that is an excellent time to be overweight risk assets. As we can see below, this has been the case for nearly all of 2023. And as we have seen, the growth outlook is still supportive of being overweight stocks, just to a lesser extent than it was 12 months ago.

The past year has very much been a goldilocks period for stocks. Falling inflation and rising growth. Now, given inflation has likely bottomed and should see some upside pressures moving forward, the rest of 2024 is likely to fluctuate between goldilocks and reflation, where both growth and inflation rise in unison.

Again, this is still a relatively supportive environment for the stock market, but less so than it was. The below chart illustrates the relationship between growth and inflation and their implications for asset allocation. As it stands, we are likely in an environment where commodities and economically sensitive sectors of the market are likely to perform best. Given the recent strength in commodities, the price action seems to be confirming this notion.

Of course, while such an environment should support risk assets, it generally does the opposite for bonds. The outlook for the business cycle (and inflation) does not appear overly supportive of the bond market. Thus, investors should be aware of the upside risk this poses for yields moving forward.

Market pricing: time for a rotation?
So, while the outlook for the business cycle appears very favourable and largely supportive of risk assets, we must consider these forward-looking indicators in comparison to what markets are pricing in.
As we can see below, large cap US equities have done an excellent job in pricing in the forthcoming rebound in the business cycle. This makes sense given the Nasdaq in particular is very forward-looking. In contrast, emerging markets and ex-US equities are less so as they are more sensitive to the actual underlying trends in growth given these markets consist of less growth/tech companies and more industrial and natural resources related stocks.

As it stands, these long-duration equity sectors such as the tech and semiconductors are pricing in a PMI of around 60-65, very much the top of the range to which the leading indicators are suggesting. As a result, these markets are very much priced to perfection such there is likely limited upside from here.

The fact positioning is confirming this notion further emphasises that outperformance from here is likely to come from other areas of the market.
In comparison, some of the more cyclically sensitive areas of the market such as the materials and industrials sectors that are shorter in duration and more reliant on actual economic growth have seemingly much more upside.

The same can be said of commodities. It appears we are entering the expansionary stage of the business cycle in which we see underlying economic growth translate into higher commodity prices.

Overall positioning in commodities is also far more supportive of higher prices than it is for the S&P 500.

Thus, from a business cycle perspective, commodities and cyclical sectors appear to offer the best risk/reward moving forward, given they stand to benefit from a pick-up in the business cycle and have priced in little of the forthcoming expansionary phase of the cycle.
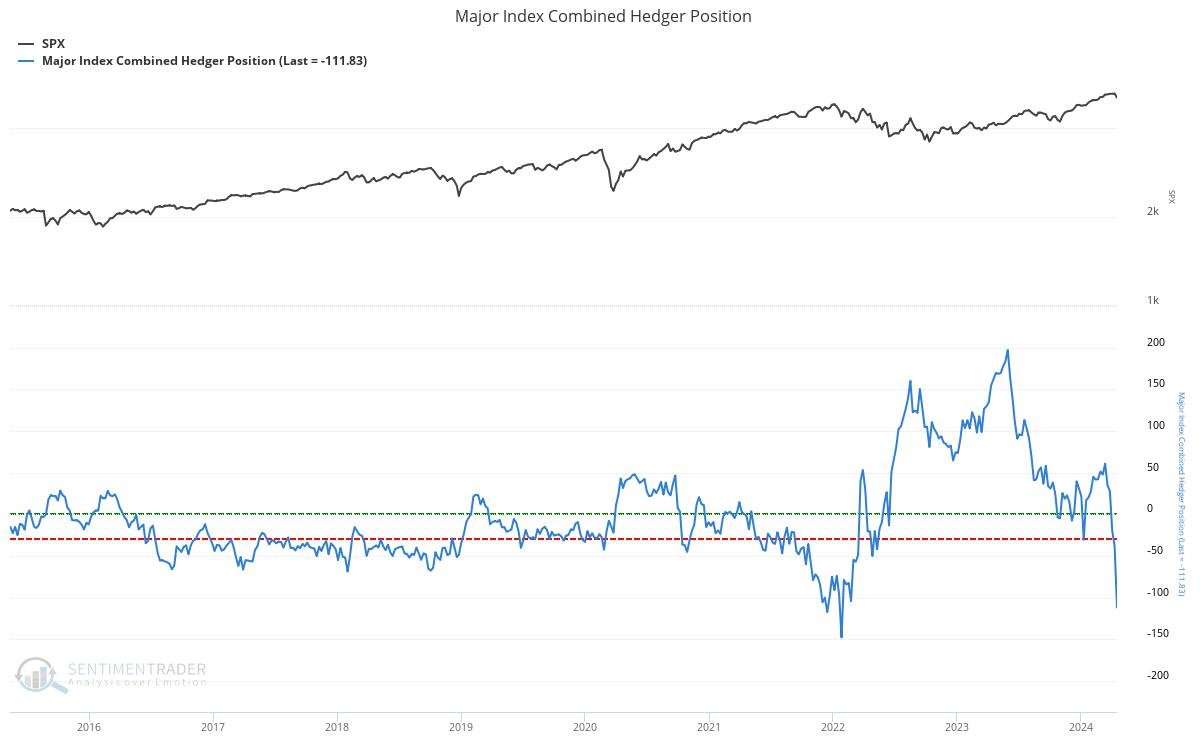
Having said that, some areas of the commodity complex have seen large moves of late, notable industrial metals. Investors should keep in mind speculative positioning in growth sensitive commodities such as copper have spiked of late. Commercial hedgers (inverse of speculators) have significantly reduced long positions these past few weeks, per the below.

In fact, economic and commodity bullishness has become increasingly consensus in recent weeks, as we can see via Bank of America’s latest Fund Manager Survey below. This doesn’t mean risk assets won’t move higher (as they continue to be supported by a robust economic outlook), but we may just need to see an unwind in speculative positioning in both stocks and commodities in the near future before these markets are able to move higher, as the outlook for the business cycle suggests they should.

. . .
Thanks for reading!
If you would like to support my work and continue to allow me to do what I love, feel free to buy me a coffee, which you can do here. It would be truly appreciated.
Regardless, feel free to share this with friends and around your network. Any and all exposure goes a long way and is very much appreciated. Thanks again.