Why We Won’t See A Recession In 2024
Summary & Key Takeaways
The jobs market is unlikely to lead to recession in 2024.
Wage growth continues to trend lower, while a spike in unemployment that would trigger a recession appears unlikely from here.
In fact, the leading indicators of employment growth suggest we are close to a bottom, and employment growth should start to pick-up as we progress through 2024.
How much further wage growth can fall from here remains to be seen, but it seems unlikely we return to pre-COVID levels.
As it stands, the labour market is one that doesn’t warrant rate cuts, nor is it one that requires rate hikes.
Don’t expect unemployment to lead to recession
The debate between a hard landing and soft landing has been raging for some time now. To me, the outcome is likely to be determined by the labour market. And, while the jobs market is clearly not as tight as it was 12 months ago (evidenced by the steady decline in wages of late), there are plenty of signals suggesting we won’t see a material rise in unemployment that would equate to a hard landing and recession.
In fact, there are signs we may even see the labour market slowly begin to tighten from here.
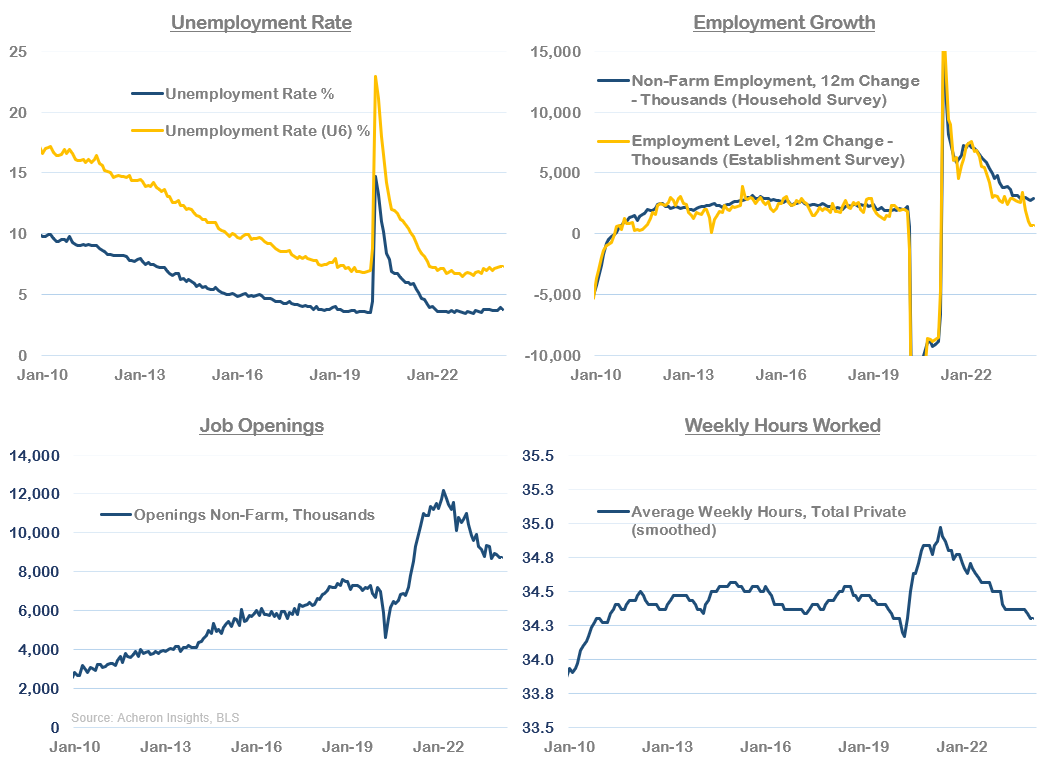
The jobs market is cooling, but won’t get much colder
As we can see below, the jobs market has been normalising in quite a constructive manner over the past 18 months. Employment growth has been cooling, job openings have declined markedly while average weekly hours worked have returned to pre-COVID levels. All the while, the unemployment rate has barely budged off its cyclical lows.
Similar trends can be observed on the wage front. The below dashboard shows wage growth as measured via a number of different data points and sources. And, as we can see, there has been a swift deceleration in wage growth since its peak in 2022.

While this decline in wage growth has been constructive, and unit labour costs look to have returned to pre-COVID levels, the Atlanta Fed’s Wage Growth Tracker is still reporting ~5% wage growth. For the Fed, there remains work to be done on the wage front, as we shall see when we examine the wage growth leading indicators in detail later and their implications for services inflation.
One of the driving factors of both the wage growth spike and subsequent deceleration this past year has been the supply of workers. The labour force participation rate and employment to population ratio fell dramatically following the COVID lockdowns and are only now reaching pre-COVID levels. However, both remain below the pre-COVID highs and illustrate the structural supply issues the jobs market continues to face, despite the recent decline in wage growth. This is particular notable when we consider how the baby boomers who saw increased retirements throughout COVID are not returning to the workforce (more on this later).

What likely bears more responsibility for the recent decline in wage growth is immigration. Which, under the Biden administration has grown significantly over the past three years, helping to alleviate much of the shortages in labour supply.

In addition to an expansion of labour supply, labour hoarding by businesses and corporations has also allowed wage growth to cool while avoiding a spike in unemployment.
There are a number of ways to assess whether firms are labour hoarding. One, is by comparing the University of Michigan Consumer Sentiment Survey with the Conference Board Consumer Confidence Survey. The former has a greater emphasis on overall personal finances, business conditions and consumer expenditures, while the latter is more focused on employment and jobs. As we can see below, for much of 2023, the U-Mich survey declined to a far greater extent than the Conference Boards, suggesting that consumers were becoming increasingly worried about personal finances and overall business conditions, but not overly worried about employment.

Another means to gauge whether labour hoarding is taking place is within the NFIB’s Small Business Survey. As we can see below, for much of 2023 we saw a similar divergence unfold between small business earnings trends and plans to increase employment. Small business earnings and profitability declined at a much more significant pace than hiring intentions.

As a result, we have seen a steady decline in both wage growth and employment growth, but little rise in unemployment. The fact that jobless claims remain floored at cyclical lows is testament to this.

The jobs market is clearly normalising, we mustn’t lose sight of the big picture. That is, the labour market is still relatively tight - just not as tight as it was. Indeed, there remains a clear dearth of labour supply, as measured by the excess in job openings versus unemployed persons.


It makes sense then downside momentum of labour market data is waning. Or, in the case of employment, accelerating to the upside. As we can see below, the three-month annualised growth rates in employment, weekly hours and hourly earnings are all equal to or above their respective, year-over-year growth rates.

If we look at the various categories on unemployment, we can also see the demographics to which layoffs are generally more elastic - those who are foreign born or have less-than-college education, the rate of unemployment remains at or near cyclical lows.

If anything, the loosening of the jobs market we have seen this past year looks to be nearing a cyclical trough, as evidenced by the cyclical components and industries of the jobs market. The below dashboard highlights various measures of these cyclical areas of the Labour market, with the standouts being the manufacturing, construction, retail and transportation/warehousing sectors. On a year-over-year growth basis, all appear to be forming some kind of cyclical low, and none have seen any deceleration over the past six to 12 months.

However, in order to confirm a cyclical upturn in employment, I would like to see a pick-up in manufacturing overtime hours along with the ISM manufacturing employment survey, which has yet to occur.
But, as it stands, cyclical employment growth has now more-or-less been flat for nearly a year. It also tends to lead non-cyclical (i.e. services) employment, suggesting the decline in the latter should reach its conclusion in the coming months.

Overall, the jobs market has normalised materially from its very tight levels of 12 to 18 months ago, highlighted by a steady decline in wage growth without a commensurate spike in unemployment.
Confirming this notion is the Kansas City Fed’s Labour Market Conditions Index, which is an aggregate measure of the status of the labour market. As we can see below, this index has fallen dramatically over the past year on an absolute and rate-of-change basis. However, the level of deceleration looks to be slowing while the index itself remains at a fairly elevated level relative to recent history.

Indeed, there is evidence to suggest we may be close to the cyclical low in employment growth, meaning the loosening of the jobs market may be slowly coming to an end. On to the leading indicators.
The leading indicators of employment growth are turning up
Not only are the coincident indicators of the jobs market showing signs of stabilisation, but as we shall see, the leading indicators of employment growth are sending a similar message. What’s more, there are some signs we could indeed see a pick-up in employment growth as we progress through 2024. However, it remains too early to call just how meaningful any such acceleration in employment growth (and subsequent decline in unemployment) will be from current levels.
Beginning with my composite leading indicators of employment and unemployment. Here is my Employment Leading Indicators versus the year-over-year change in non-farm payrolls.

And here it is inverted versus the 12-month change in the unemployment rate.

Clearly, this leading indicator peaked/troughed nearly a year ago and has been trending sideways since. And although it is yet to move materially higher (for employment, lower for unemployment), it does suggest we are unlikely to see a meaningful decline in employment growth or rise in unemployment from here.
Delving into the various leading indicators themselves, we can see temporary help growth - which tends to lead employment growth by around six months - looks to have passed its trough and is moving higher.

The same can be said of the Conference Board’s Employment Index.

Ditto credit conditions.

And corporate profit margins.

Meanwhile, economic growth itself looks to be beginning to reaccelerate. The ISM Manufacturing PMI, which tends to lead employment growth by around six months.

We must remember, employment is one of the most lagging economic indicators these is. So, any weakness in the jobs numbers we are seeing now is reflective of where the economy was six months ago, not necessarily as it stands today.

As such, while we may continue to get some weak jobs numbers over the next few months (in addition to downside revisions to recent data), we must keep in mind the leads and lags when interpreting such information.
In fact, as I have written about much of late, the outlook for the business cycle over 2024 looks very constructive. The below dashboard highlights several key short and long-leading indicators of the business. All are pointing to a re-acceleration in the business cycle, one that is likely to provide upside pressure to employment growth as we progress through 2024.

However, some indicators are still suggesting some form of labour market loosening could be on the cards in the short-term. First, the Plans To Increase Employment components of the NFIB’s Small Business Survey (inverted below) has dropped significant over the past couple of months.

While my ISM employment composite (which includes both manufacturing and non-manufacturing ISM employment data), has yet to tick-up.

As such, while many leading indicators of employment suggest we are unlikely to see material downside in employment growth from here, it is not yet unanimous. Thus, while we should see employment growth pick-up later in 2024, we can’t be sure unemployment wont spike from here (given it is self-reinforcing in nature), but there is plenty of evidence to suggest it won’t.
All quiet on the wage growth front
Switching gears from employment to wages, that we have seen wage growth decline without a commensurate spike in unemployment has been a most constructive outcome, one that soft landings are made of. But, from an inflation and monetary policy perspective, the question now becomes how much further wage growth can decline from here.
As it stands, the leading indicators of wage growth are more or less pointing to moderate downside from here, as indicated by my composite leading indicator below. But, it’s too early to make the call wage growth is going to return to pre-COVID levels (at least when measuring wages via the Atlanta Fed Wage Growth Tracker).

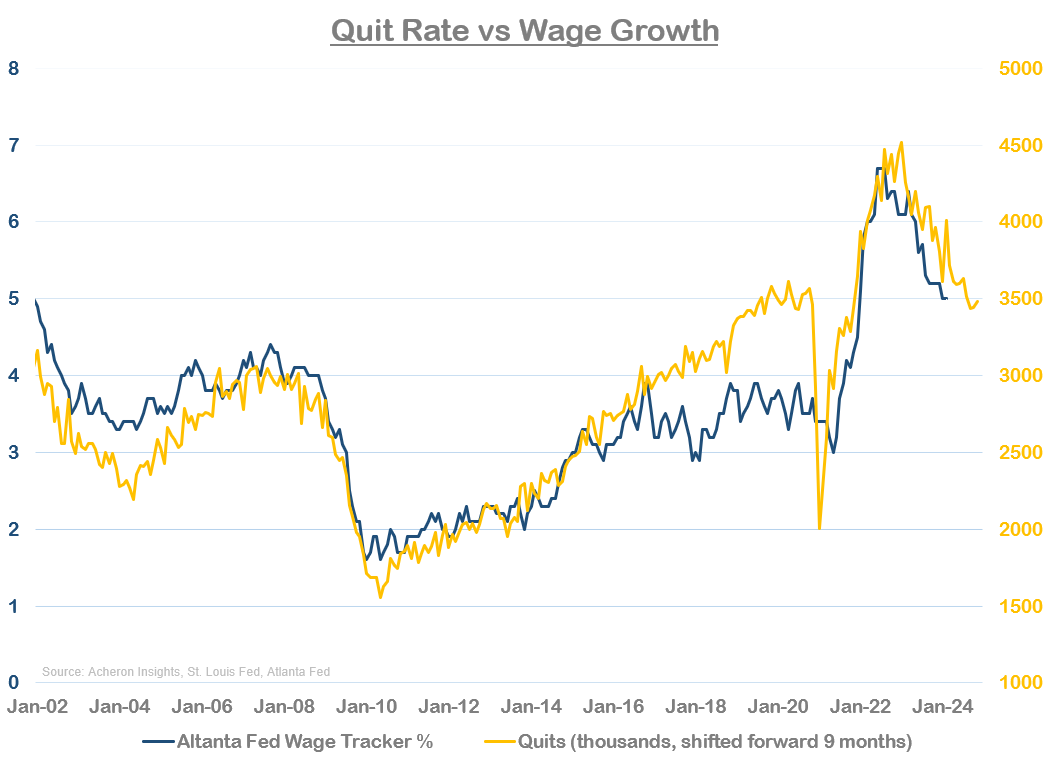
One of the key drivers of wage deceleration in recent times has been the deceleration of the number of people quitting their jobs. A high quit rate is something generally seen during a tight labour market, as employees quit existing jobs in favour of higher paying jobs elsewhere. Quits tend to lead wage growth by around nine months and suggest further downside in wage growth is likely from here.
What has been sending a similar signal has been job openings, which also leads wage growth by around nine months. Unlike quits, the decline in openings has seemingly stalled in recent months, but is yet to tick higher (more on this shortly).

Small business job openings on the other hand (six-month lead versus wage growth) continue to decline.

As do small business plans to increase employee compensation (six-month lead).

As well as small business plans to increase employment (nine-month lead).

Thus, we should expect wage growth to continue to trend lower from here, or sideways at the very least. It also seems too early to suggest upside wage growth pressures are likely in the near future (remember, wages lag the business cycle).
While I remain skeptical wage growth will return to pre-COVID levels, the downtrend should continue in the short-term. But there are some indicators suggesting we could see a fairly significant acceleration in job openings as we progress through 2024, which should eventually translate into upside pressures in wages.
Job openings are generally highly correlated to the stock market as a result of how financialised the US economy has become.

And given how well stock prices have performed over the past year (particularly those of the mega-cap technology stocks who were the primary drivers of falling labour demand in 2022 and early 2023), it seems labour demand could see a commensurate rise later in 2024. This is a message being confirmed by growth in corporate earnings.

As well as CEO confidence.

In summary, wage growth is likely to continue to trend sideways to down over the next three to six months, but there are signs we could see a pick-up in labour demand throughout 2024, which could put a floor under any material decline in wage growth.
In addition, it is also important to remember the supply of labour is likely to be impaired on a structural basis. Even though supply has caught up with demand to some extent of late, the below chart breaks down labour supply by cohort and illustrates how it has been driven by an increase in female workers and those aged in the 25-54 bracket. On the other hand, the baby boomers aged 55+ who retired en masse amidst the COVID boom in asset prices have not been returning to the market, and given they remain as wealthy as ever, are highly unlikely to ever do so. This will leave the jobs market at some kind of structural deficit, and one where it may be difficult for wage growth to return to previous levels on a sustained basis.

Implications: Recession, inflation and monetary policy
There are signs of a soft landing in the jobs market, but not one that warrants rate cuts.
From an inflation perspective, wage growth is closely linked to services and rent inflation. As we can see below, for rent inflation to continue to trend lower it must be accompanied by a move lower in wage growth.


The same relationship can be viewed when looking at wage growth and overall services (ex-energy services) inflation.
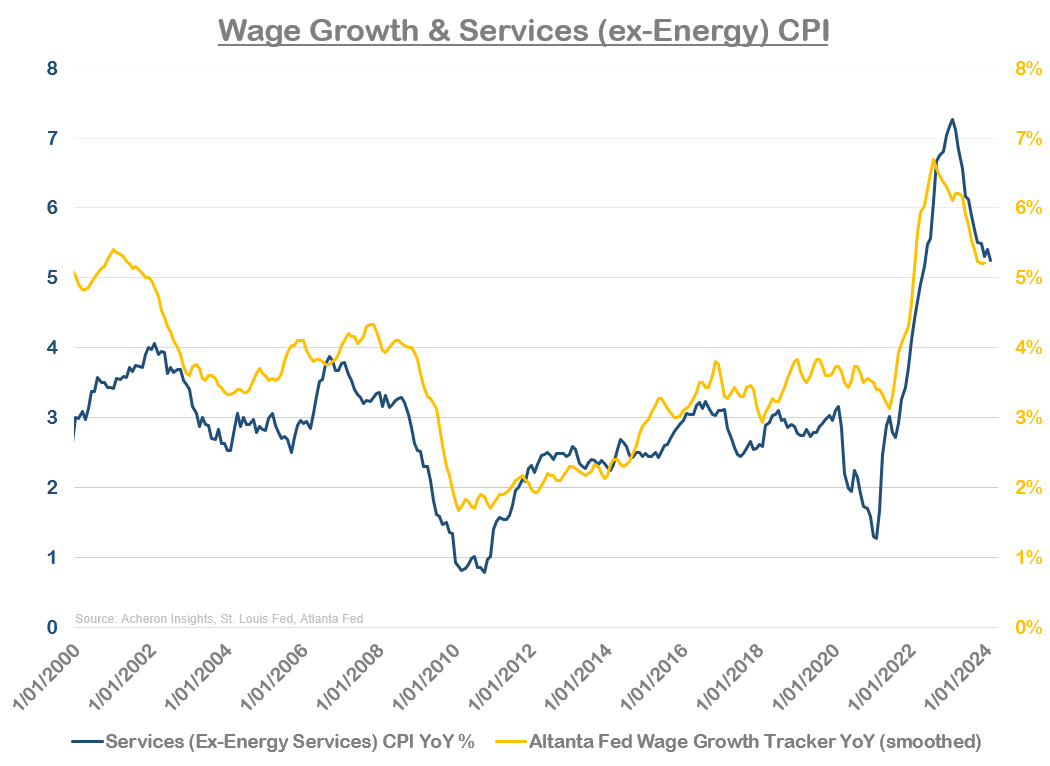
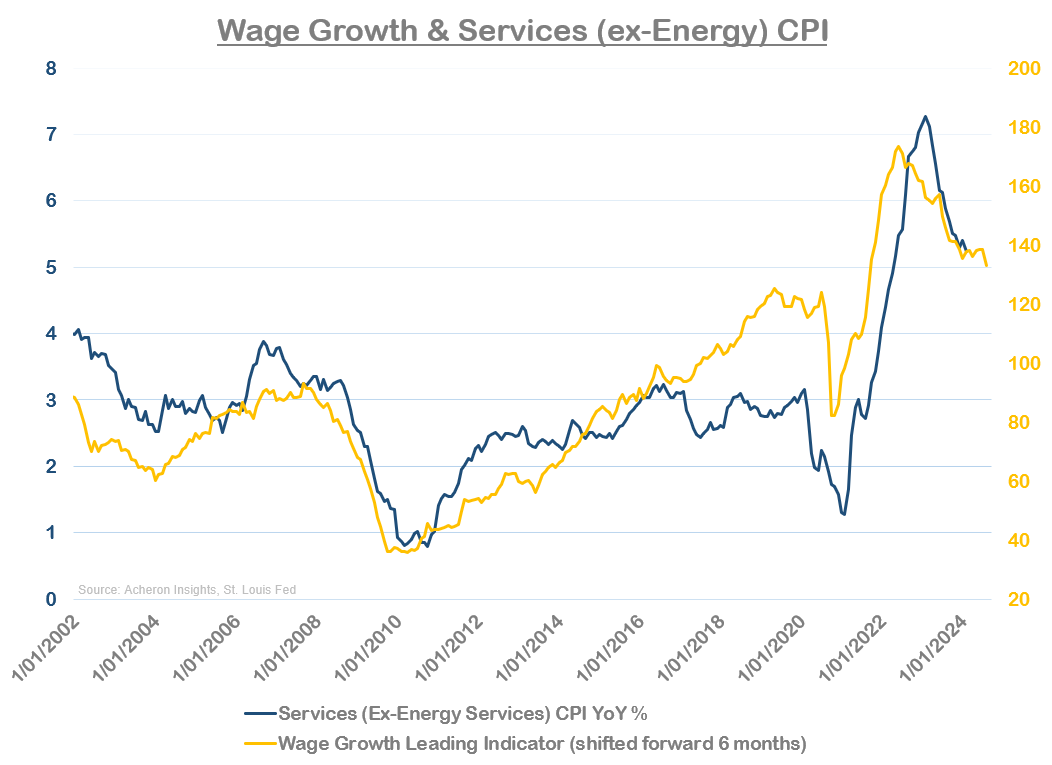
As we have seen, wage growth is likely to continue to trend lower, which should support a continued downtrend in Services CPI. But again, there are no signs yet wage growth and services inflation are guaranteed to return to the pre-COVID levels that favour dovish monetary policy.
And, if we see upside pressure on job openings and employment growth later in 2024, then the floor for Service CPI is likely to be well above 2%. Such an outcome would restrict the Fed’s ability to implement their three planned rate cuts for 2024. The jobs market is cooling, but not to the extent it warrants significantly easier monetary policy, particularly as it seems unlikely we see a material spike in the unemployment rate (and thus little chance of recession).
. . .
Thanks for reading.
If you would like to support my work and continue to allow me to do what I love, feel free to buy me a coffee, which you can do here. It would be truly appreciated.
Regardless, feel free to share this with friends and around your network. Any and all exposure goes a long way and is very much appreciated. Thanks again.