The Economic Downturn Is Underway, But Expect A Rebound In 2024
Summary & Key Takeaways:
Economic resilience continues to be the theme of 2023, with the strength of consumer balance sheets and the resilience to higher interest rates the primary factors supporting the US economy.
However, based on the short-leading indicators of the business cycle, we should see hard data deterioration in the coming months, which have thus far been contained to the manufacturing sector.
Whether this ends up in recession of simply a cyclical slowdown depends on how well the jobs market can hold up.
Longer-term leading indicators have picked-up meaningfully however, suggesting we could see a strong rebound in growth throughout the second half of 2024.
Meanwhile, stocks and credit markets are priced to perfection from a business cycle perspective, leaving them vulnerable should growth not meet expectations.
Where are we in the business cycle?
Within my previous deep-dive on the state of the US economy, my overriding thesis was although economic resilience has been the theme of 2023, we were likely to see a slow but steady deterioration in hard economic data as we approached the end of 2023 and entered 2024. This thesis has largely proved true and, as we shall see, remains my general outlook today.
In assessing the current state of the business cycle, my preferred means to view coincident economic data is through my Business Cycle Index, which is a composite of key data points from all areas of the economy: consumption, incomes, employment and manufacturing. As we can see below, this Business Cycle Index has more or less been trending sideways over the past year after a strong deceleration from the post-COVID boom. As of the latest available data (October), economic growth remains robust. That is to say, the economy is neither in recessionary territory nor is it expanding.

The economic resilience of 2023 is perhaps better illustrated when viewing this index on a six-month annualised growth basis. After reaching near negative levels in early 2022, 2023 has seen a decent bounce on the back of an economy that has proved far more resilient to higher interest rates and tighter financial conditions than many expected.

Another way I like to assess the state of the business cycle is through the lens of the ISM Manufacturing PMI (a soft data input which provides a timlier measure than the Business Cycle Index above, which consists of hard data points, but is obviously biased towards manufacturing and is thus more cyclical than a broad index of hard economic data). As it stands, the PMI is in contractionary territory (sub-50) and clearly confirming the slowdown in the manufacturing side of the economy, but it is not necessarily at recessionary levels.

Meanwhile, the Conference Board’s Leading Economic Indicator (which consists of a range of economic data points such as the ISM Manufacturing PMI) is also firmly in contractionary territory. While soft data points in the form of surveys have been biased downward over the past 18 months due to high inflation, were we not to enter a recession, this would be the largest drop the Conference Board’s LEI has experienced without recession in history. Should this current slowdown indeed avoid recession (there is a decent probability of this in my book), this would go to show just how different this cycle has been relative to those we have seen in recent times.

Continuing our journey through the current state of the economy, the unemployment rate looks to finally be ticking up off its cycle lows, something the leading indicators of the jobs market have been signalling for some time now. Whether this economic slowdown does culminate in recession or a soft landing depends much on the path of unemployment.

Digging deeper into the individual economic data points themselves, we can see below both real personal consumption and real incomes excluding government payments declined materially in late 2021 and into 2022, but have since steadied and even rebounded slightly, as measured on a six-month annualised growth rate basis. The decline in industrial production was similar, but the rebound this year has been far less pronounced as the manufacturing sector has again returned to contractionary territory. Meanwhile, employment growth has remained relatively strong and above-trend for the entirety of 2021 and 2022. Although employment growth is slowly trending lower, it remains at levels roughly equal to those seen throughout the pre-Covid decade, illustrating just how tight the jobs market has been and remains still.

In terms of momentum, the trend in industrial production has again become particularly pronounced to the downside and is now in outright contractionary territory, as mentioned. Consumption also looks to be now showing downward momentum, though consumption overall remains robust. Meanwhile, momentum in incomes and employment remain steady. Clearly, we are yet to see a diversified slowdown in hard economic data, as the economic deterioration thus far remains relatively contained within the industrial/manufacturing sectors.

Overall, economic growth as measured on a coincident basis remains fairly neutral, again confirming the resilient economy theme myself and others have been preaching for much of 2023. We are yet to see the sea of orange and red that would coincide with a trough in the business cycle, but we do seem to be getting ever closer.

Delving a little deeper into the manufacturing sector, we can see a variety of hard economic data points for the sector confirming this slowdown. In addition to industrial production, capacity utilisation for the manufacturing sector and manufacturing employment growth are both negative. However, manufacturing new orders has ticked up over the past several months, which seems to be suggesting the slowdown in the manufacturing sector may be nearing a trough. This is something the leading indicators of the business cycle are suggesting, as we shall discuss shortly.

So then, why has the economy been so resilient despite weakness in the manufacturing sector along with the leading indicators of the business cycle having suggested a severe economic slowdown was on the cards in 2022/2023?
As I have discussed in the past, there are several reasons as to why this is, many of which are centered around the notion that the average consumer or corporation is simply not as exposed to interest rates as many thought they would be. Overall, the strength in the US economy can be attributed to a confluence of the following:
Strong household and corporate balance sheets;
Limited consumer exposure to interest rates and tightening credit conditions (particularly given the fixed nature of most US mortgages);
Corporations having little exposure to the credit cycle downside, having refinanced on ultra-low rates during 2020 and 2021 with refinancing needs not scheduled to pick-up materially until 2024;
Limited exposure of the US economy to the cyclical manufacturing sector;
Strong and persistent wage growth; and,
The success and residual effects of fiscal stimulus.
One of the most important dynamics highlighted above has been the battle of the manufacturing versus services sectors. After all, the US economy is primarily a services economy. Although the manufacturing sector is a large driver of the cyclicality of the business cycle, the dynamics within the services sector are what define the overall trend in economic activity.
If we compare the slowdown in the manufacturing sector illustrated in the above chart to measures of growth of the services economy below, the contrast is stark. And yes, some of the divergence between the two can be attributed to the fact that manufacturing is more cyclical and tends to lead the services sector, but services consumption growth is still significantly higher than any level seen in recent decades. In addition, wage growth, employment (ex-manufacturing and construction) and the services PMI are all holding up well. But it must be said, wage growth and services employment look to be slowly trending lower, as does services consumption.

Moving on to households, outside of household savings as a percentage of disposable income, the current state of household activity remains relatively robust. Again, this can be attributed to the fact that households have had very limited exposure to rising interest rates and a deteriorating credit cycle thus far. This in turn is a result of the fact they have de-levered significantly only the past decade and their balance sheets remain well above the long-term trend. At some point however, the cyclical nature of the business cycle and credit cycle will have an impact, though I suspect any downturn in household related consumption won’t reach recessionary levels.

Household sentiment also looks to have improved slightly this year, with both the Conference Board and University of Michigan sentiment surveys having picked up off the early 2022 lows. While survey data such as this have been driven much more by inflation and energy costs as opposed to an actual downturn in consumer and household activity, it is worth noting the divergence between the two. While the UMich survey remains near levels last seen around the GFC, the Conference Board survey remains at fairly robust levels, implying household finances have indeed weakened to some extent (captured within the UMich survey), while their employment and income situation remains relatively robust (captured by the Conference Board).

And although it has yet to be truly reflected by hard economic data, housing buying conditions for goods, vehicles and housing remain well below any level seen in over 40 years.

Moving on now toward the small business sector, here is another signal that things under the hood of the economy are showing signs of stress. Per the NFIB Small Business Survey, expected business conditions and small business who consider this a good time to expand both are at or near cycle lows, while small business credit conditions are also at their lowest levels since the GFC recover. Hiring plans are also slowly trending lower.

The housing market also looks to be rolling over once again after having rebounded in 2023. The NAHB Housing Market Index (HMI) has returned to cycle lows, as has the traffic of prospective buyers. This is an important dynamic as the housing market and its associated construction and consumption are one of the primary cyclical drivers of the business cycle.

And finally, another indicator worth highlighting is the Federal Reserve’s Sahm Recession Indicator. As explained via the St. Louis Fed, "The Sahm Recession Indicator signals the start of a recession when the three-month moving average of the national unemployment rate (U3) rises by 0.50 percentage points or more relative to the minimum of the three-month averages from the previous 12 months. This indicator is based on “real-time” data, that is, the unemployment rate (and the recent history of unemployment rates) that were available in a given month. The BLS revises the unemployment rate each year at the beginning of January, when the December unemployment rate for the prior year is published. Revisions to the seasonal factors can affect estimates in recent years. Otherwise, the unemployment rate does not revise.”
As we can see below, this recession indicator just reached its highest level seen outside of a recession since the 1960’s. Now, I must preface this by noting I have no strong view as to whether we end up in recession or simply a cyclical slowdown, it is worth highlighting such indicators as they do provide some insight into the current state of the economy.

So, as we have seen, the economy has remained relatively robust throughout 2023, with most sectors outside of manufacturing having seen some level of growth during the year. However, the overall trend in hard economic data looks to be slowly trending lower, suggesting we are clearly in the later stages of the business cycle.
Hard economic data should continue to deteriorate in the months ahead
While a review of the current status of the business cycle is informative, hard economic data is lagging economic data, so it provides little value from an investment perspective. As investors, we need to live in the future, thus it is of far more value to assess the direction of growth in the business cycle for the months ahead.
My base case for much of this year has been that economic growth would trough around Q4 of 2023 or Q1 of 2024. This remains largely my view today. This thesis is appearing to be more and more likely as many leading indicators of hard economic data continue to suggest we see board economic deterioration in the coming quarter or two.
Confirming this notion is Bloomberg’s hard data stress index, which has finally caught up to soft data stress, of which the latter has been bearish for nearly 24 months now. Historically, when the economy experiences both hard and soft stress in economic data, growth tends to slow to levels at or near those of a recession.
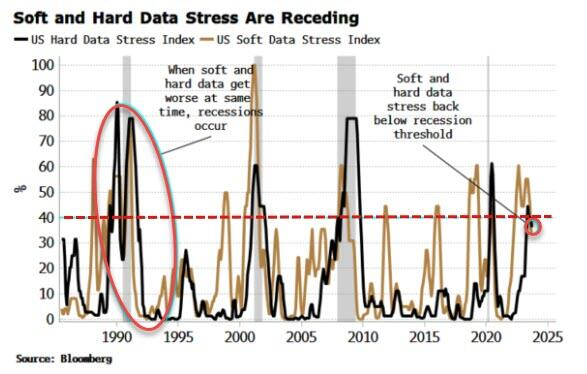
Source: Simon White - Bloomberg
The Atlanta’s Fed’s GDPNow projections for Q4 have also been heavily revised downward in the past couple of weeks, suggesting real GDP growth for Q4 will come in closer to 1% that the 2% previously projected.

Source: Atlanta Fed
We can see these projections again below, along with the St. Louis and New York Fed’s respective forecasts. Again, here is another signpost that hard economic data is slowing down during Q4 and the economic resilience seen throughout 2023 is waning.

In terms of nominal GDP, this shows just how hot the economy has been running over the past couple of years. Nominal GDP growth for Q3 was 6.3% YoY, well above any level since prior to the GFC. However, as has been the case for some time now, household net worth as a percentage of GDP (historically an excellent leading indicator for nominal GDP growth) suggests nominal GDP should move lower over the next quarter or two.

Lending standards (i.e. the credit cycle) are also suggesting a similar deterioration in the months ahead. This is particularly the case for commercial and industrial loans as well as credit card loans, and as these credit conditions tighten, industrial production and retail sales growth tend to contract on roughly a three-month lag. As I detailed here, the impacts of the credit cycle downturn should start to be felt in a more pronounced manner as we enter 2024.


My hard data leading index - which combines a number of leading economic indicators such as the yield curve, building permits, ISM New Orders among others - also suggests near-term growth deceleration is expected. However, this index has actually moved higher over the past month or two, and given it tends to lead hard economic data by around six months, this suggests growth in hard data should start picking up around Q2 of next year and the downturn itself may be shallower than many are predicting.

And finally, another leading indicator of hard data (and perhaps the timeliest indicator of the business cycle itself) is the ISM Manufacturing PMI, which tends to lead the Business Cycle Index by around three months. Again, the message here is a deterioration in hard data is likely in the next one to two quarters.

Understanding the leads and lags of the business cycle is integral for investors and traders alike. Hard economic data is lagging economic data, particularly when it comes to things like the labour market and inflation. So, even though we are assessing the most recent hard data in the form of things like industrial production, consumption, incomes and employment, as of the time of writing the latest releases for said data is only October this year, thus, using an indicator such as the ISM Manufacturing PMI helps provide a much more timely illustration of where the business cycle currently sits. As we can see below, these hard economic data points all lag the PMI by around three to twelve months, give or take.

On the other hand, indicators such as financial conditions, ISM survey subcomponents, policy rates, food and energy prices as well as residential investment are all leading indicators of the PMI itself. Some indicators lead the PMI by up to two years (such as manufacturing and commodity prices), while others have lead times as little as three months (the ISM New Orders less Inventories spread for example). Understanding where the PMI is and where it is heading is the most important aspect to business cycle analysis, investing and asset allocation. While it is not without its flaws, the PMI is the most up to date representation of the business cycle, it leads hard economic data and its movements are most closely related to asset prices.
Leading indicators are suggesting a growth rebound in 2024
As we transition now to the fun part, that is, where the leading indicators of the business cycle are suggesting growth is headed over the next 12 to 18 months, things continue to look increasingly positive.
Starting with my macro financial conditions index, which is a composite of interest rates, the dollar and oil prices (key long-term drivers of the business cycle and corporate profitability), this index continues to suggest the PMI should bottom at some point over the next three months or so before moving materially higher throughout 2024.

Commodity and manufacturing prices are suggesting something very similar as the negative implications of the inflation impulse dissipate.

While food and energy inflation are also sending a similar signal for the trajectory of the PMI over the next year or so.

As is the ISM Manufacturing Prices Paid index, a subcomponent of the ISM survey. This index also tends to lead the overall PMI by around a year.

Interest rates and borrowing costs are one indicator however that remains bearish for the outlook of the economy. A big headwind facing the US economy remains the credit cycle, and as we see a pick-up in corporate refinancing come 2024, we should expect this to strain growth to a certain degree. Thus, unless rates roll over materially over the next few months, this dynamic will probably put a ceiling on any rebound in the PMI.


The same can be said of global monetary policy conditions. Although we are obviously well past peak hawkishness, monetary conditions remain relatively tight. Again, unless we see a material easing cycle over the next year (unlikely), global monetary conditions will again cap any business cycle upturn to a certain degree.

Turning now to the inventory cycle, this is another leading indicator of the PMI pointing to a material rebound in growth over the next year. Much of the growth headwind that resulted from the build-up of inventories in 2020 and 2021 has run its course. This bull-whip effect should again be a tailwind to growth come 2024 as manufacturers once again look to re-stock inventories.

In terms of the housing market, residential investment also looks to have reached a bottom. When measured as a percentage of total private fixed investment, housing related investment tends to lead the PMI by around 10-12 months. Although the negative growth implications from the housing market are most likely past their peak, until we see a material pick-up in housing related investment, any pick-up in growth will remain limited.

The same message can be gleaned from building permits, another leading indicator driven by the cyclicality of the housing market.

And finally, the ISM Manufacturing New Orders less Inventories spread (which leads the PMI by around three months) also continues to move higher, again suggesting a bottom in the PMI (and thus the manufacturing sector as a whole) is near.

Asset markets are priced to perfection
So, while hard economic data should deteriorate as we progress through Q4 and into Q1 of 2024, we can see there are a number of leading indicators of the PMI suggesting the outlook for economic growth over the next year could surprise to the upside. But, as investors, not only do we want to invest in risk assets with the business cycle as a tailwind, another key consideration associated with such analysis is the outlook for the business cycle relative to what asset markets are pricing in.
As it stands, most asset markets are priced to perfection. As we can see below, equity markets (the Nasdaq in particular) have largely priced-in any rebound in the PMI the leading indicators suggest is coming.


This notion of “price to perfection” is even more pronounced when we compare cyclical stocks versus defensive stocks, with the ratio pricing in a PMI in the high 60s… crazy stuff.

The same can be said of the high-beta/low-beta ratio, though not quite to such an extreme degree.

Industrial commodities on the other hand look to be trading more in-line with the near-term trajectory of economic growth. This makes sense given things like copper are primarily demand driven commodities.

Yields on the other hand have de-coupled from their traditional relationship with the business cycle in recent times. While slowing growth and falling inflation have historically been perfect conditions for duration, the environment for interest rates this cycle is different. While we will see a rally in bonds at some point (akin to what we have seen this past month), the supply and demand mismatch remains undoubtably bearish.


Credit markets on the other hand - like stocks - are priced to perfection. Not only is the business cycle a headwind over the short-term, but the outlook for the credit cycle also appears unfavourable.

Thus, junk bonds pricing in a PMI of over 55 seems ambitious over the medium-term.

. . .
Thanks for reading!
If you would like to support my work and continue to allow me to do what I love, feel free to buy me a coffee, which you can do here. It would be truly appreciated.
Regardless, feel free to share this with friends and around your network. Any and all exposure goes a long way and is very much appreciated. Thanks again.