How High Can Stocks Go In 2024?
Summary & Key Takeaways
Rising liquidity, a resilient economy and strong household balance sheets have supported corporate earnings and stocks over the past year.
And, while the leading indicators of the business cycle suggest a rebound in growth is likely later in 2024, the stock market has largely priced this in. As such, we should see a rotation out of growth/tech and into real economy sectors and hard assets moving forward.
While the jobs market is treading between hard landing and soft landing, inflation continues to be sticky and should limit the levels of rate cuts the Fed can undertake in 2024. Markets may be to reprice to this dynamic.
Although liquidity has been supportive of risk assets in recent times, stocks have also become richly priced relative to underlying liquidity, which itself could turn less favourable toward risk assets in Q2.
In addition, stock market internals continue to trend unfavourably, and are suggesting the market is in need of some kind of pull-back and/or consolidation before moving higher.
Sentiment and position are also reaching fairly extreme levels, and may need a wash in the short-term.
A positive backdrop for stocks, but risks remain
The stock market has been on a tear since the latter stages of 2022. No question. The 25% rally in the S&P 500 since October is testament to this. With crypto booming and speculative furore back to levels not seen since 2021, it seems likely the easy money has been made, at least for now. Thus, at times like this it is well worth stepping back and objectively assessing how high the stock market can actually go in 2024.
One of the dynamics whose footprints are all over the positivity in equities for much of the past year has been the resilience in the US economy. While I have been expected to see some kind of slowdown in coincident economic activity at the turn of the year, no such material slowdown as occurred.
While the economy did decelerate markedly during 2022 (which was inevitable given the boom in 2021), growth has held firm (and even rebounded slightly) over the past year.

As many of the traditional leading indicators of the business cycle were pointing to a material downside in the economy for much of the past 12 months, this left many investors and money managers underweight risk assets. All the while, growth and corporate earnings have surprised to the upside.
A primary reason for this resilience in the economy and in corporate earnings has been the positive state of household balance sheets. Yes, there are signs household financial stress is on the rise, but overall, households are still on solid footing from a debt and debt serviceability perspective.

Meanwhile, the actual outlook for the economy continues to trend favourably. My Hard Data Leading Index has been moving higher in recent months, meaning that any downturn in hard economic data may only be brief.

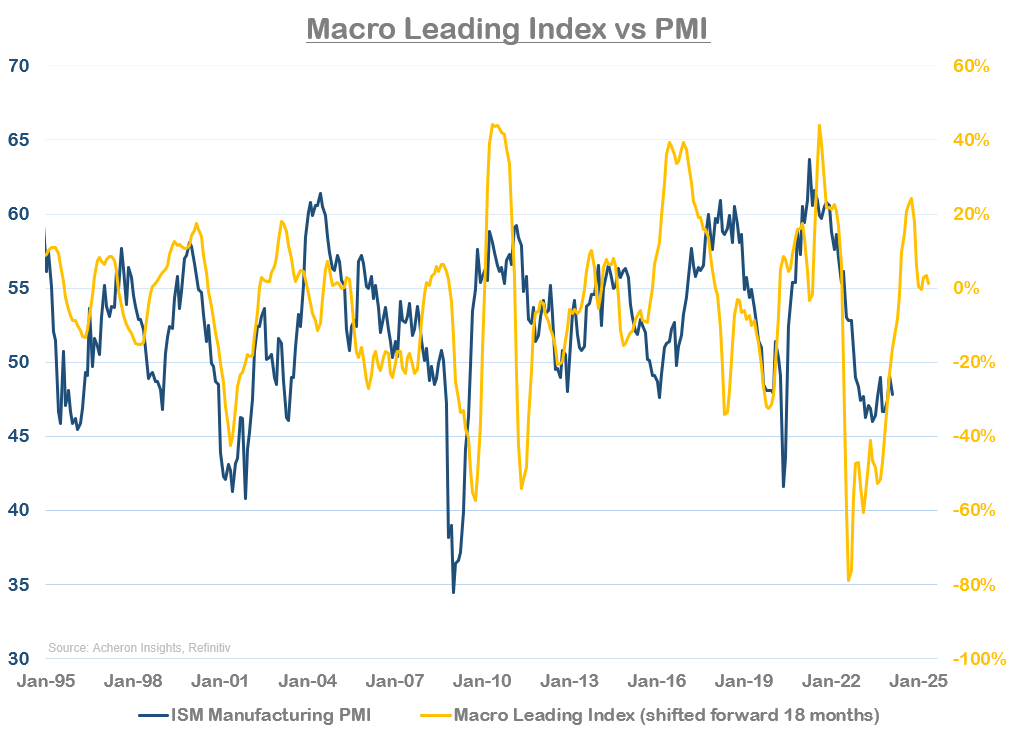
And of course, other longer-term leading indicators such as my Macro Leading Index (which leads the ISM Manufacturing PMI by around 18 months), continues to suggest we will see an expansion in the manufacturing sector throughout 2024.
Likewise, the monetary policy cycle is also no longer pointing to a downturn in global economic activity over the next 12 months as central banks worldwide have been slowly retreating from their hawkish stance.

It is perhaps the outlook for employment and inflation that will be the key determinants of whether we do get a recession in 2024 in addition to how far down this easing cycle the Fed and other central banks can tread.
In terms of employment, the jobs market has been largely supportive of the soft landing narrative that has also been so supportive of equity markets in recent times. The past year has seen a slow decline in wage growth without any commensurate pick-up in unemployment. A key driver of this dynamic has been labour hoarding by businesses, who do not want to let go of workers given the difficulty of replacing those with the requisite skill set, but neither are they looking to expand employment.
While signs of a deteriorating jobs market are absolutely popping up (and it is important to remember spikes in unemployment are generally convex in nature as layoffs beget further layoffs), it is worth noting my Employment Leading Indicator did bottom some months ago. However, I continue to believe we probably will see a pick-up in unemployment at some stage in the coming months, though it is unlikely to be anything that exhibits a major recession. I will be watching the direction of this leading indicator with great interest in the months ahead.

The same can be said of wage growth. My Wage Growth Leading Indicator is declining, but only at a similar rate to wage growth itself.

What should perhaps be of greater concern to equity markets is inflation. I wrote back in January how upside inflation pressure are likely to reappear as we enter 2024, a call that has so far proved prescient.
Headline CPI continues to exhibit clear upside momentum on a month-over-month basis, while remaining well above the Fed’s 2% target on a YoY and MoM annualised basis.


Meanwhile, the base effects that have been supporting disinflation over the past year are set to fall off in the coming months, meaning that by mid-year, base effects could start to bias inflation measure to upside rather than the downside, just as the Fed is expected to start cutting rates.

However, this does not necessarily mean inflation will move higher anytime soon. Shelter inflation (the largest component of the CPI basket) will continue to trend lower over 2024. This will remain a strong disinflationary dynamic. But instead, what we are likely to see is a number of upside inflationary pressures offset much of the decline in Shelter CPI, an outcome which should see inflation remain above the Fed 2% target. This is what my various leading indicators of inflation are suggesting.

As is my overall inflation leading indicator.

This is not necessarily bearish. Policy makers have clearly stated they are happy to begin easing with inflation above their target (hence why risk assets have been so eager to price in rate cuts). But, these dynamics of both the jobs market and inflation have significant implications for the extent of monetary easing the Fed can undertake.
As we can see below, relative to the historical relationship between the Fed Funds rate and Core CPI, monetary policy is current closer to tight than it is easy.


Unless inflation moves markedly lower from here, it will only take a couple of 25 bp cuts by the Fed to push monetary policy back toward the loose end of the spectrum. This may be palatable when inflation is below target, but is unlikely to be so when inflation is above target.
Regardless, it seems all but guaranteed we will see at least a couple of rate cuts around the middle of the year (we are in an election year after all). As we can see below, relative to employment growth monetary policy is also currently tight, thus allowing some scope for rate cuts.

While the same can be said of monetary policy relative to economic growth.

However, there isn’t a whole lot of data (yet) supportive of more than a couple of rate cuts. If we look at the history of dovish Fed pivots relative to several key economic and market data points, the Fed generally doesn’t cut interest rates based on where the market and economy sit today.

Monetary policy may be closer to tight than loose, but it is clearly far from restrictive.
This is an important dynamic to monitor given markets are pricing in significant interest rate cuts in 2024, which was another key driver of the stock market in recent times. The key term here is was. Primarily a result of the recent inflation stickiness highlighted above, the cumulative number of rate cuts priced into markets in 2024 has halved from 150 bps to 75bps, yet the stock market has been completed unfazed by this repricing.

And, given how much of the PMI rebound in 2024 I have discussed has already been priced into equity markets, it seems to me that risk assets are priced to perfection, at least on a short-term basis.

In addition, while these dynamics leave the large indices in the S&P 500 and Nasdaq vulnerable to a correction or consolidation, these dynamics also suggest the market rally could become broader based as we progress through 2024, given the relatively robust outlook regarding global manufacturing.
Moving forward, it seems likely we will see a rotation out of high-beta and liquidity sensitive sectors (i.e. tech) and into real economy sectors, such as commodities. This rotation seems to be supported by recent price action.
Speaking of liquidity, this has been another important dynamic supportive of equity markets for much of the past 12 months (if not the most important). As we can see below, my Global Liquidity index has been moving higher in-line with the stock market in recent times, however, as it stands, the stock market appears to perhaps have gotten a little ahead of the actual underlying liquidity dynamics for now.

We can view this dynamic differently by isolating the liquidity impulse of US M2 relative to US stocks. As we can see below, the stock market looks to be reaching a point where it is have become richly priced versus the actual expansion in M2, again leaving equities perhaps somewhat vulnerable over the short-term.

We can see a similar dynamic at play below when comparing the disparity that has opened up between the S&P 500 (red line) and Net Liquidity (proxied via commercial bank reserves, blue line).

As we can see above, this measure of liquidity has again clearly been supportive of risks assets since bottoming out at the end of 2022. For the past year, the entire reduction in the Fed’s balance sheet via QT has been completely offset (and some) by the drawing down of the Fed’s Reverse Repo Facility.
Now, the problem is the outlook for Fed Net Liquidity for the second quarter of the year appears far less favourable. Not only do stocks appear extended relative to liquidity, but the RRP has been drained significantly in recent months. As such, it is unlikely it will continue to be depleted at the same pace it has been of late (particularly as the Treasury increases the percentage of Coupons relative to Bills they issue). In addition, the second quarter of the year is generally a time where the Treasury sees an increase in tax inflows relative to overall government outflows, which itself could cause the Treasury General Account to rise, thus reducing commercial bank reserves.
Overall, given we are in an election year the incentives for policy makers is to continue to leave the liquidity taps fairly loose (the last thing they want is another regional banking crisis…). Whether this comes in the form of the complete draining of the Fed’s RRP facility via the US Treasury continuing to issue a high proportion of Bills relative to Coupons, or it is via the Fed tapering their QT program, there is a clear path for liquidity to continue to be supportive of markets throughout much of 2024. Overall, liquidity won’t be a major headwind this year, but it is also unlikely to be the same tailwind it has been in recent times.
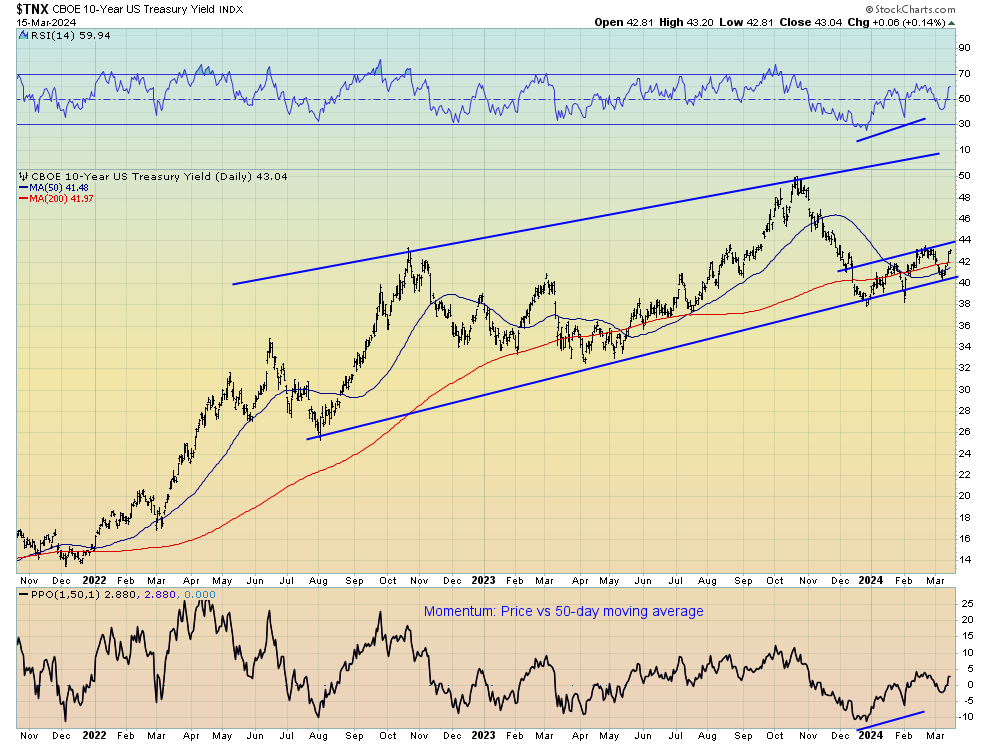
Additionally, it is also important to remember yields remain a headwind to risk assets.

Again, this dynamic to be is likely to be supportive of a rotation out of the high-beta, liquidity and interest rate sensitive sectors and assets and into more cyclical and economically sensitive areas of the market. This should be particularly true of the long-duration risk assets - such as tech - which have performed so well of late but have diverged materially from yields.

Clearly, the market is also betting on a retreat in interest rates from here. But as it stands, yields continue to move higher. Outside of a recession, I don’t see a path to materially lower interest rates given the supply and demand imbalance that remains for bonds.
One significant risk facing markets in 2024 and 2025 is the potential for a rise in credit spreads as the corporate refinancing cycle begins. As I detailed recently, as a result of corporations terming out their debt at record low rates in 2020 and 2021, in addition to the strength of household balance sheets, the economy has thus far shrugged off the credit cycle downturn. However, as the refinancing cycle begins in 2024 and accelerates in 2025, we could see a situation where credit spread re-price higher. This is something my Credit Spreads Model has been suggesting for some time now.

Shifting gears away from the economic and monetary policy outlook as it relates to the stock market and toward investor positioning and sentiment, we can see aside from hedge funds, sentiment and positioning has now shifted dramatically from the near-record bearishness that was evident in late 2022 to levels of extreme bullishness. This is very much the case in relation to asset manager positioning, volatility targeting fund positioning, as well as in various surveys such as the AAII Bull-Bear spread and the NAAIM Exposure.

Meanwhile, Goldman Sachs’ measures of CTA and systematic equity positioning are also exhibiting max bullishness.

While the Goldman Sachs Sentiment Indicator recently soared to multi-year highs.

But, where it is not the case is in relation to hedge funds, who remain largely underweight equities. As a result of this, overall speculative positioning in the S&P 500 remains at relatively neutral levels.

While it is clear overall sentiment and positioning have become relatively stretched, there is plenty of scope for hedge funds to drive stocks higher as we progress through 2024, we may just need to see an unwind in other sentiment and positioning metrics first.
This is a dynamic to which market internals have been suggesting for some months now. Put simply, my measures of market internals - my Pro-Cyclical Index and Risk-Appetites Index - have both diverged notably from the S&P 500 of late. This does not mean markets need to move significantly lower, but such diverges do suggest the short-term upside in equities is probably limited from here.


Putting it all together, it’s clear there are a number of favourable and less than favourable dynamics facing markets at present. The liquidity and growth outlook remain fairly supportive over the next 12 months or so, but the broad indexes in the S&P 500 and Nasdaq have done an excellent job of pricing these dynamics in. Meanwhile, positioning and sentiment is reaching relatively elevated levels, but could still move higher given hedge funds remain underweight risk assets. It may just be that positioning needs to be unwound first, in a similar manner to what occurred in September last year.
On the other end of the spectrum however, the credit cycle remains a significant risk to markets, though it may well be this is a risk for 2025 as corporate refinancing accelerates, rather than 2024. A hawkish repricing from the Fed still cannot be ruled out. While it is also worth noting unemployment remains close to cyclical lows, and history suggests equity markets are limited in their ability to rally on a sustained basis when employment sits at such levels.

And finally, from a technical perspective, the picture remains very interesting. We are in a clear up-trend, as the S&P 500 continues to make higher highs and higher lows. However, the market also looks to be forming a bearish ascending wedge pattern accompanied by negative divergences in momentum and RSI, while we have also triggered a couple of daily 9-13 DeMark sequential sell signals. Clearly, the market cannot continue to rally in its current form forever, and it seems clear that some form of pull-back (and potentially buyable dip) is likely over then near term given the growing signs of trend exhaustion.

. . .
Thanks for reading!
If you would like to support my work and continue to allow me to do what I love, feel free to buy me a coffee, which you can do here. It would be truly appreciated.
Regardless, feel free to share this with friends and around your network. Any and all exposure goes a long way and is very much appreciated. Thanks again.