The Inflation Battle Isn’t Over Yet
Summary & Key Takeaways
The volatility components of inflation - goods, food and energy - are unlikely to be the drivers of disinflation going forward that they have been in recent times.
In fact, leading indicators of Goods CPI are suggesting upside inflationary pressures may re-emerge as we progress through 2024.
And although Shelter CPI will continue its decent and drive Core CPI lower, we are unlikely to reach the Feds 2% target and stay there for any meaningful amount of time.
Given financial markets are pricing in a swift decline in inflation and expecting imminent rate cuts, we may be in for a volatile 2024 should the trend in disinflation come to an end.
Is inflation finding a bottom?
The past 18 months have seen significant development be made on the inflation front. And haven’t risk assets enjoyed it. On a year-over-year basis, no matter which CPI or PCE measure you choose, inflation is down significantly from its peak. However, the fight against inflation is not yet won, with all major inflation indices still well above their pre-COVID averages, let alone the Fed’s 2% target.

And, even though the stickier measures of inflation such as Core PCE and Sticky Prices CPI (ex-food and energy) continue to make encouraging progress to the downside, it appears as though some of the more volatile components of inflation, such as goods, food and energy, may be close to exhausting their downward momentum.
Indeed, the disinflation we have seen these past 18 months in goods, food and energy should hardly be surprising. Supply chain normalisation was always going to happen, just as unfavourable base effects were going to work against rate-of-change metrics following their peak. Unfortunately, the same cannot yet be said of services inflation. Yes, we will see Owners’ Equivalent Rent continue its slow decline throughout 2024. But, as it stands, the jobs market is still relatively tight and wage growth stubbornly strong. That Super Core Services CPI (ex-shelter) continues to grow at an annualised rate of 4.5% over the past six months is testament to this.
What’s more, despite the strong disinflation from the most volatile components in CPI, headline inflation looks to be settling in around the mid-to-low 3% area. As I shall touch upon later, this is a higher thought for inflation than the market expects.

What we are seeing now is the broad breadth of disinflation of the majority of CPI constituents across the back half of 2022 and most of 2023 seems to have exhausted itself. As we can see below, median inflation for December grew at 0.42% month-over-month, and continues to growth at a rate above 5% on annual basis. We are also starting to see an increase in the percentage of CPI components rising at a rate greater than 0.2% per month, suggesting the number of CPI constituents experience inflationary pressures is now on the rise.
These trends don’t necessarily mean CPI will turn up meaningfully (as most constituents only make up a small component of the CPI basket), but both charts suggest the broad disinflation across the whole CPI basket we have seen over the past year is likely over, meaning any further decline from here will much narrower (i.e. only driven by OER, and whatever happens with rents/services/wages). It also means headline CPI could be vulnerable to upward pressures from goods, food and energy.

Source: Michael Ashton - Inflation Guy Blog

Source: Variant Perception
Digging a little deeper into inflation momentum, we can see below how downside momentum in Core CPI and Services CPI (ex-shelter) simply hasn’t been there in recent months. And while good progress is being made on the Core PCE front, it is important to remember that Core PCE is historically 0.5-1% lower than Core CPI. And even though headline CPI is now coming in below the Fed’s 2% target when measured on a three-month annualised basis, the same still cannot be said of Core CPI or Services CPI (ex-shelter).

Again, as mentioned above, it is important to remember the majority of the decline in inflation we have seen since its mid-2022 peak has been from a combination of energy disinflation (and outright deflation in recent times), food disinflation and goods disinflation. We have seen little to no reprieve in services disinflation (ex-shelter), and only a small decline in shelter inflation.

For inflation to meaningfully move below the Fed’s target and stay there, it must be driven by a sustained move lower in not just Owners’ Equivalent Rent (which is coming), but also in Rent CPI and Services CPI (ex-shelter), while the volatile components in food, goods and energy must remain subdued. As we shall see, such an outcome is far from a sure thing.

Inflation leading indicators are turning up
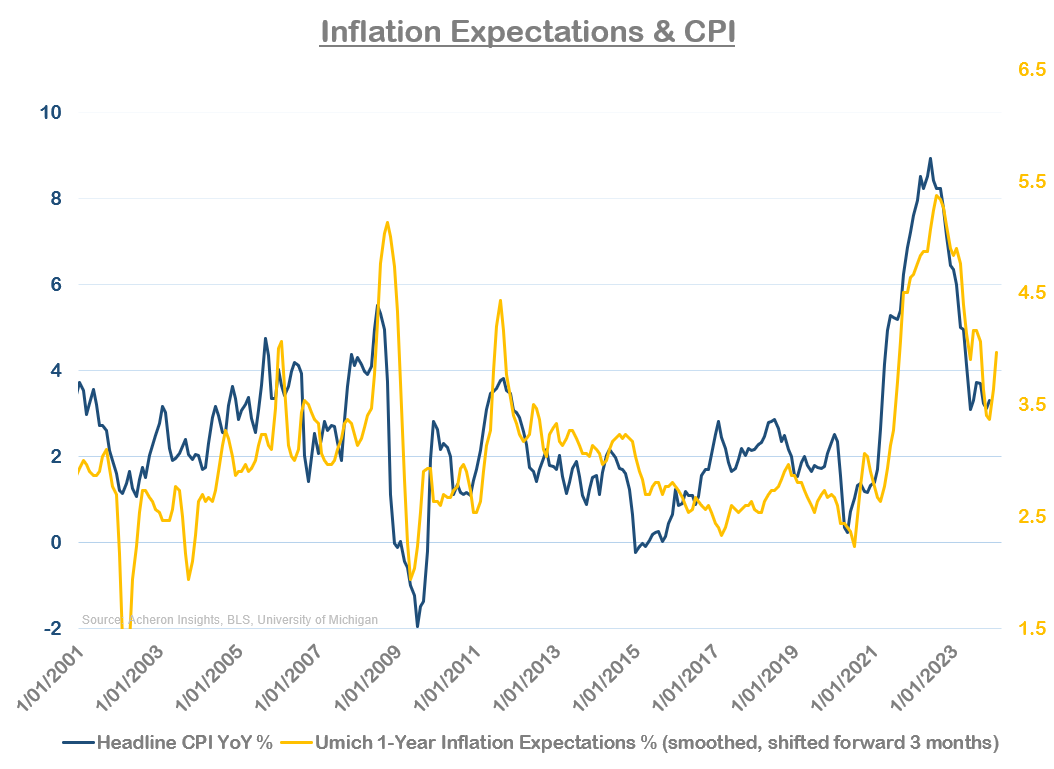
Turning now to the outlook for inflation, the number one chart that continues to be cause for concern for those suggesting the fight against inflation is done is my Composite Inflation Leading Indicator. Not only has this indicator found a bottom, but it has in fact turned higher over the past few months. And, given its four-to six-month lead on Headline CPI, this suggests upside CPI pressures are indeed forthcoming.

We are also seeing inflation expectations start to tick back up, measured below via the University of Michigan’s 12-Month Inflation Expectations Survey.
What’s more, we now have a situation on our hands where the most timely indicators of the business cycle - such as the ISM Manufacturing PMI - look to be forming a bottom. And, given the PMI has historically lead inflation by around nine months (as inflation lags economic growth), while the outlook for economic growth throughout the second half of 2024 appears rather constructive, the disinflationary pressures from a slowing economy will probably be exhausted over the first quarter of 2024 (barring a severe recession during this period, which is not my base case).

Goods inflation on the rise?
An even timlier means to assess the link between economic growth (particularly that most closely associated to the manufacturing sector) is by looking at the relationship between CPI and the ISM Manufacturing New Orders less Inventories spread, an indicator which provides both a solid lead on economic growth and inflation. Thus, should we see manufacturing activity continue to pick up as 2024 progresses, we ought to see this show up in renewed upside pressure on Goods CPI.

The fact that manufacturing prices have not been making any progress to the downside for months now also suggests there is unlikely to be any further downside movement in goods inflation.

The same can be said of industrial commodities, whose movements are closely linked to the manufacturing of goods. Base effects are also set to work as a tailwind to rate-of-change measures of industrial commodities from here on out too.

Ditto producer prices.

Over recent months we have also seen a slight acceleration in retail sales, another indicator which provides a solid lead on inflation, namely Goods CPI.

And what is perhaps the most notable development over the past few months is the return of supply chain pressures, this time stemming from attacks on container ships by the Houthi Militants in the Red Sea.
What we have thus far seen as a result of these attacks is several shipping companies redirecting their fleets to use other means to travel between Europe, Asia and the Middle-East that does not involve the Suez Canal, Red Sea or Bab al-Mandeb Strait. And, so long as the Houthi’s continue down this path, we should expect to see high insurance costs for shipping companies, higher day rate for container ships, and thus, higher freight costs, all of which will find their way into the cost of goods in one form or another. This has absolutely been the case thus far, as container freight costs have doubled in recent months.

Geopolitical risks such as these I believe will be a mainstay for at least the coming decade, and is one of the reasons as to why I believe inflationary pressures this decade will persistently exceed that of the 2010s.
All told, supply chain constraints are returning and are in turn likely to put some upward pressure on inflation as we progress through 2024.

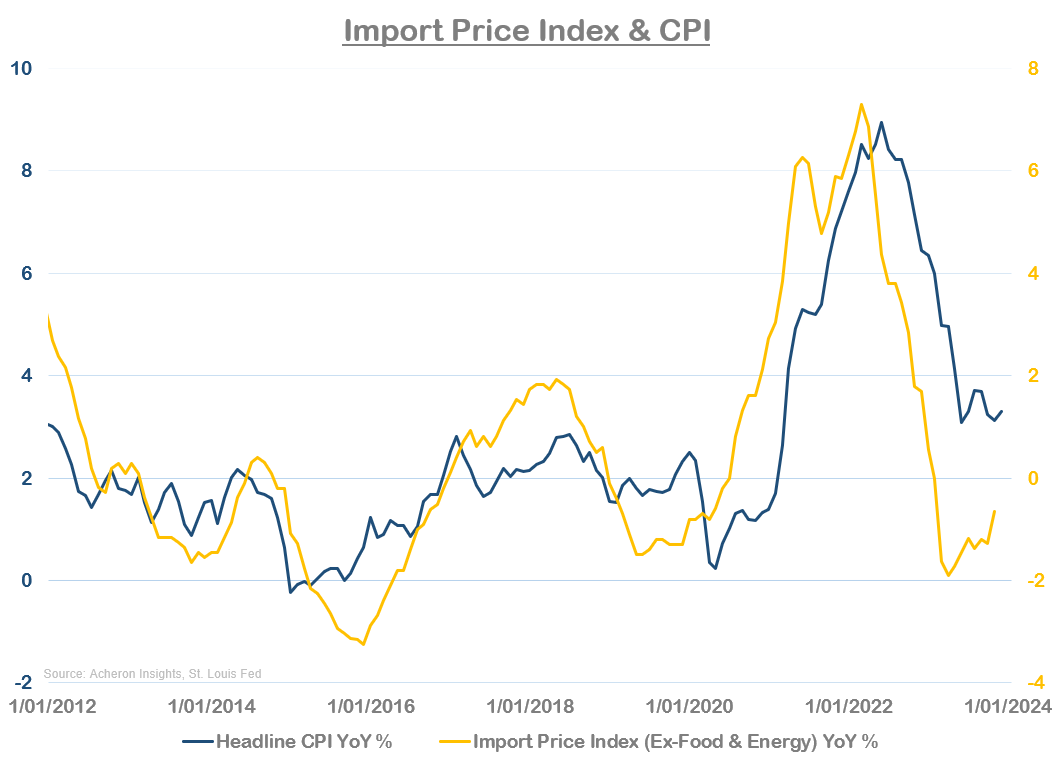
What we are also likely to see in 2024 is the disinflationary pressures that arose from a strong dollar to be exhausted. Obviously, a strong dollar increases pricing power for US consumers and businesses when purchasing goods manufactured in foreign countries, which is in turn finds its way into domestic prices. This is why the yearly rate-of-change in the dollar tends to provide a solid six-to-nine-month lead in inflation. As we can see below, on a rate-of-change basis, the dollar has been weakening for the past year.

Thus, it seems likely we are finding a bottom in import prices for goods, which has also been a big driver of disinflation of late.
Another big driver of disinflation since mid-2022 has been the devaluation of the Chinese yuan, which greatly impacts US import prices of goods from China. The disinflation pressures from a weaker yuan look to have come and gone.

We can also extend the relationship between US CPI and Chinese economic activity through the lens of the China Producer Price Index, which tends to lead US CPI by around three months as higher manufacturing prices for Chinese goods and passed through to Western consumers.

And, there are signs that producer prices in China may be set to rise in the coming months, as suggested by the China Manufacturing Input Prices PMI.

One final area of goods inflation worth mentioning is New & Used Vehicles CPI.
Though only a small component of the BLS’ consumer price index basket (2.5%), used vehicle inflation was a big contributor to the spike in CPI during 2021, and has been a big contributor to the disinflation seen over the past 18 months. Indeed, Used Vehicles CPI has been outright deflationary for most of 2023 (currently -1.3%). But, as we can see below via the Mannheim Used Vehicle Index (which tends to lead Used Vehicles CPI by three to four months), Used Vehicles CPI doesn’t appear to be an area where we will see any upside inflationary pressures anytime soon, but is also unlikely to be a major driver of disinflation moving forward.

But the same cannot necessarily be said of New Vehicles CPI, which makes up around 4.2% of the CPI basket and tends to lag Used Vehicles CPI. This makes sense given that approximately 74% of all vehicle sales in the US are used vehicles, so we should expect to see prices for used vehicles react to economic conditions much faster than that of new vehicles. And, given the decline in used vehicle prices is probably bottoming out, the significant disinflation seen in New Vehicles CPI over the past year is also likely to abate in the coming months.

Food inflation has found a bottom
Similar to goods inflation, Food CPI (13.4% of headline CPI) is likely very close to bottoming out.
Firstly, Food Manufacturing PPI - which leads food CPI by around six months - has not made a new low for some time now.

Meanwhile, the FAO Food Price Index is ever so slightly starting to tick higher.

Ditto fertilizer prices, a key determinant in pricing agricultural commodities.

The major agricultural commodities in corn, wheat and soybeans all experienced a torrid 2023 after booming amid the Russian invasion of Ukraine. And, even though they are yet to move meaningfully higher in nominal terms, on a rate-of-change basis (which is what matters when calculating inflation), things are picking up.

Thus, should the major agricultural commodities move higher at any point this year, this will be a significant tailwind for inflation. Of course, this is far from guaranteed as weather is a key determinant in pricing agricultural commodities, but, any market in which commercial hedgers (i.e. the smart money) are positioned this bullish tend to experience some kind of rally over the medium-term.

For now, barring an imminent rally in agricultural commodities (which I am not predicting), Food CPI is unlikely to be a major driver of Headline CPI in the short-term, either to the downside or upside.
The same can be said of energy inflation
While Energy CPI makes up only 6.7% of the CPI basket, because energy prices are able to move far and fast in a short period of time is why they can have an oversized impact on Headline CPI. And, while I expect to see oil prices hold up throughout the first quarter of 2024, I don’t see any move to $100+ oil anytime soon. Thus, in the same manner as Food CPI, Energy CPI is unlikely to be a major driver of disinflation or inflation in the short-term.


Services inflation - a tale of two indices
The biggest and most important driver of inflation over the medium-term is Services CPI, which can effectively be broken down into three parts; Rent CPI (7.7% of headline basket), Owners’ Equivalent Rent CPI (26%) and Services CPI ex-shelter (~25%).
As it stands, services inflation is a story of conflicting forces - falling house prices driving Owners’ Equivalent Rent (OER) lower and persistent wage growth supporting Rent and Services (ex-shelter) CPI.
Starting with Rent CPI, while leading indicators such as the Zillow Observed Rent Index continue to suggest downside progress is likely to continue over the coming months…
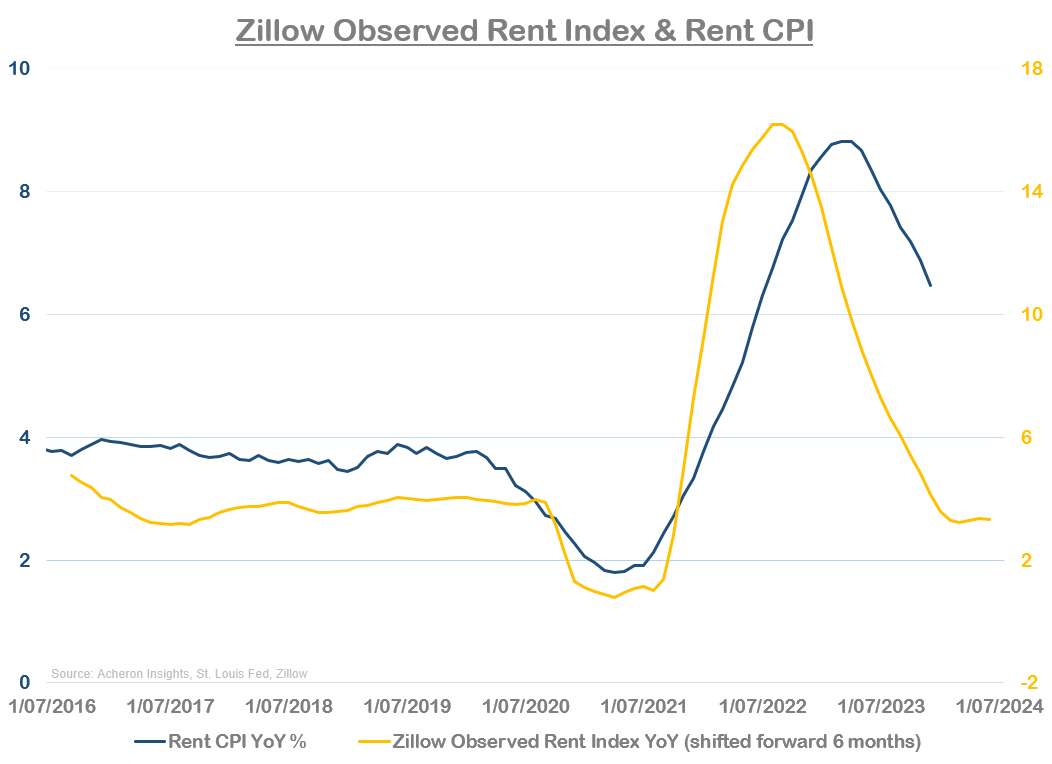
…This is not yet supported by wage growth. As a result, although we should continue to see Rent CPI slowly trend lower from here, I am not sure I see Rent CPI getting much lower than 2-3% anytime soon.

Where we can continue to expect to see a meaningful level of disinflation is in Owners’ Equivalent Rent, which is of particular importance given its ~26% weighting in the CPI basket. When it comes to OER, house price growth has historically led by around 12-18 months, and, should this relationship hold (which it seems to be doing thus far throughout this cycle), OER growth will move meaningfully lower over the next 12 months. But again, it appears unlikely to move much below the 3% range. Regardless, this is a strong disinflationary force that will put a lid on CPI measures throughout 2024 and will see Core CPI continues its decent.

The extent to which the disinflationary pressures from OER can offset any uptick in Goods CPI will also be heavily dependent on wage growth, which, along with being a primary driver of Rent CPI, is also the primary driver of Services CPI as a whole.

While wage growth has cooled over the past six months, it remains well above any level seen throughout the 2000-2020 period. What’s more, several leading indicators of wage growth are beginning to tick higher. The NFIB Small Business Survey’s Plans to Raise Prices and Compensation Plans are both suggesting a return of upward pressures in Core CPI and wage growth respectively.


While my wage growth composite leading indicator is also no longer wholly supportive of any further deceleration in wages.

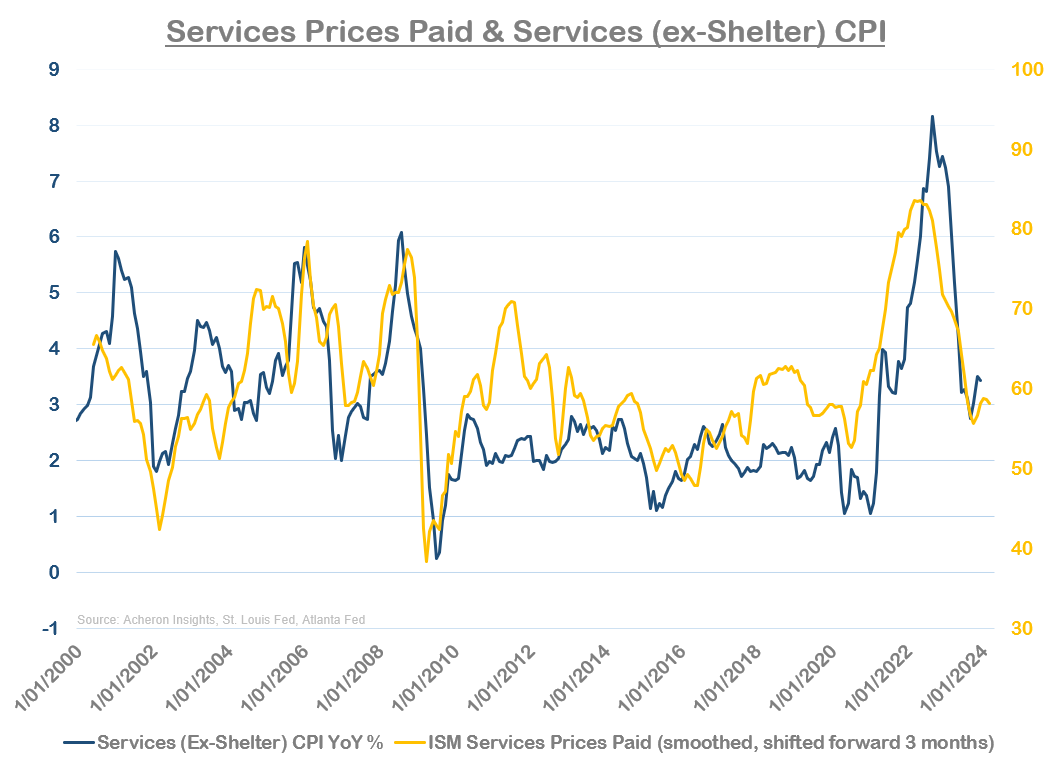
Meanwhile, other leading indicators of Services CPI - such as the ISM Services Prices Paid - are also no longer moving materially lower.

As such, while Services CPI and Core CPI is likely to continue to trend lower throughout 2024 given the outlook for Owners’ Equivalent Rent, this disinflation is likely to be slow and not necessarily supported by Services ex-shelter CPI, so long as wage growth proves sticky. Thus, we are likely set up for a period of time where services disinflation could be offset by the return of goods inflation.
What are financial markets pricing in?
At the core of any potential soft landing is the continuation of immaculate disinflation. As I detailed here and here, risk assets are now priced to perfection. Thus, should it be the case we do not see this immaculate disinflation continue and key inflation gauges struggle to get below 3% for any meaningful amount of time (the highest probability outcome in my opinion), there may be some repricing to do.
Indeed, as we can see below, 1Y/1Y inflation swap are pricing in CPI at just over 2%.

And while the market is no longer pricing in the significant level of disinflation that is was 12 months ago (as much of this disinflation has come to pass), should Headline CPI make a bottom around the 3% area as opposed to the 2% area, financial markets will need to reprice accordingly. And maybe, just maybe, we won’t get those rate cuts quite as soon as the market is expecting.

. . .
Thanks for reading!
If you would like to support my work and continue to allow me to do what I love, feel free to buy me a coffee, which you can do here. It would be truly appreciated.
Regardless, feel free to share this with friends and around your network. Any and all exposure goes a long way and is very much appreciated. Thanks again.