The Growth Slowdown Is Not Over
Summary & Key Takeaways
Both the leading indicators of growth and liquidity continue to suggest growth will slow as 2023 progresses. The housing market and the inventory cycle in particular are still material headwinds to growth, while we are still unlikely to have fully felt the ill effects associated with the tightening of financial and monetary conditions over the past year.
However, we are beginning to see some of the longer-term leading indicators inflect positively, suggesting we will see a bottom in growth at some stage this year which should in turn begin the next growth cycle upturn as we enter 2024.
For now, patience is still warranted for investors, particularly in relation to credit risk, while bonds appear to offer the most upside from a business cycle perspective over the next six to twelve months.
The current state of economic growth
When assessing the business cycle, the coincident measures of economic growth are an excellent place to start. Rather than predicting the future direction of the cycle, coincident growth metrics allow us to assess where we currently stand within the business cycle and define the trend; be that recovery, expansion, slowdown or contraction.
In similar fashion to how the NBER assesses the business cycle and uses various inputs in its recession determinations, I prefer to look at the current trends in economic growth through a broad array of indicators which cover all areas of the economy. These include such data points as industrial production, consumption, employment and incomes, among others.
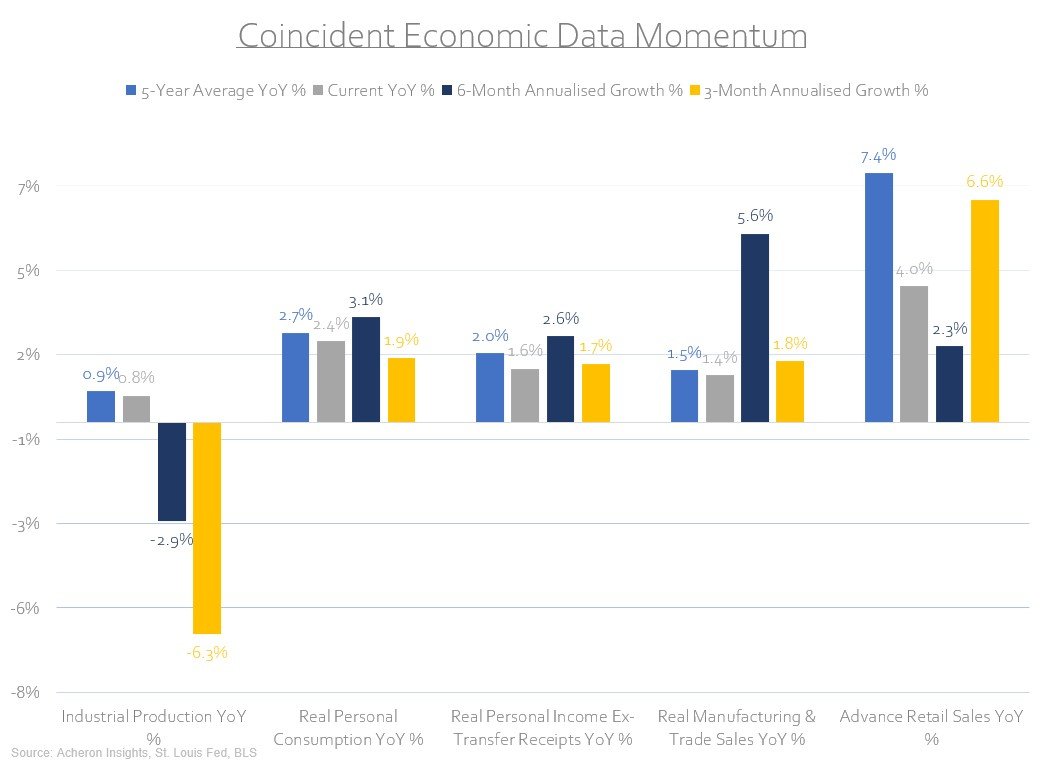
Indeed, if we assess the momentum of several of these data points, such analysis helps provide insight as to the overall trend in economic growth on both a short and medium-term basis. As we can see below, outside of the rapid decline in industrial production over recent months, coincident economic growth overall continues to plod along. Although the overall trend is clearly down, there is a clear level of economic resilience that has been present for some time now. This may however be beginning to fade, and, as we shall discover shortly, the leading indicators are suggesting a rapid deterioration in growth over the next quarter or two.
Illustrating the slowdown in industrial production and the manufacturing sector overall has been the continued collapse of the ISM Manufacturing Purchasing Managers Index (PMI), which tends to provide a fairly timely proxy for the current state of the business cycle (though it is obviously heavily linked to the manufacturing sector, which is only a small part of the US economy). While a sub-45 reading generally coincides with recession (current reading = 47.7), it is clear a cyclical slowdown within the manufacturing sector is underway (particularly now the hard data points like industrial production are finally confirming this trend).

Outside of manufacturing however, as I have said the current trends in economic growth continue to prove robust and resilient. Indeed, a broad composite of coincident economic growth - using the inputs of industrial production, employment, real incomes ex-transfer payments and real personal consumption - indicates overall growth is yet to roll over to the degree the leading indicators have been suggesting for some time. Though the trend is down, this index is not yet near the negative growth readings that have coincided with past recessions.

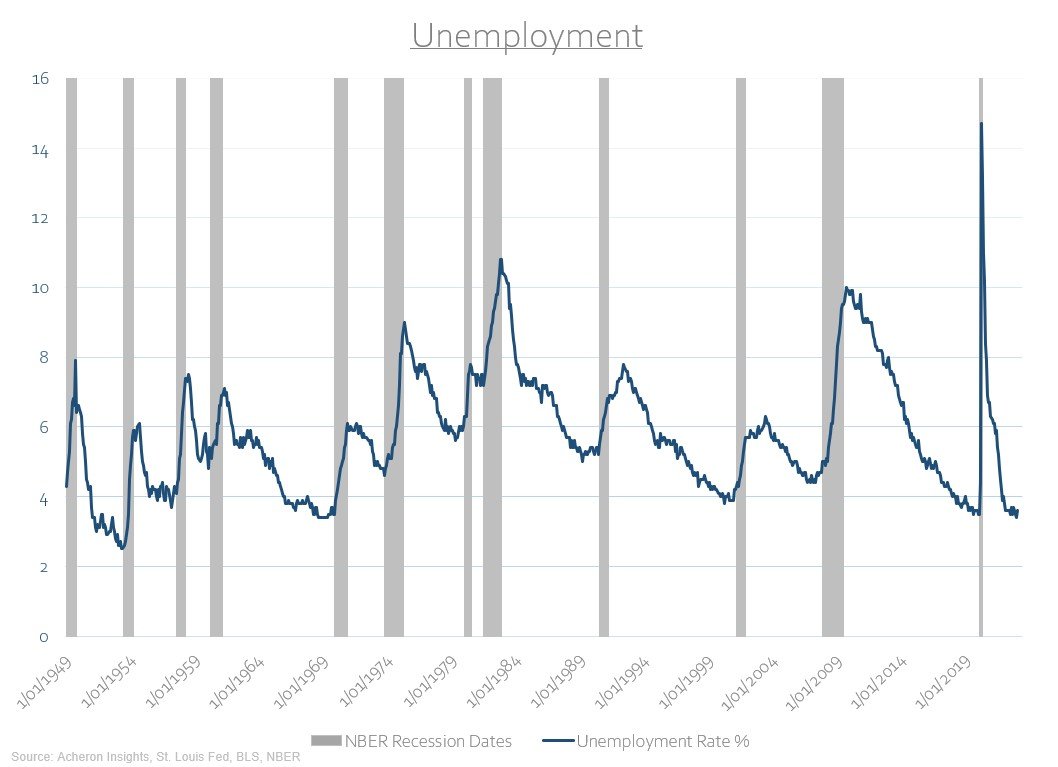
Of course, a historically tight labour market and tremendous wage growth are primarily responsible for this economic robustness. The unemployment rate remains near its lowest levels in nearly 50 years. While unemployment is of course backward looking and the leading indicators of both wages and employment are poor, the data is nonetheless strong for now.
Meanwhile, services consumption also is proving robust. The US economy is after all a services driven economy, with the services sector being responsible for roughly 80% of all job creation and over 60% of GDP. Although the manufacturing sector is a large driver of the cyclicality of the business cycle and is deteriorating meaningfully, the dynamics within the services sector are what define the overall trend in economic activity. They too remain strong for now.

So, as it stands the current trends in coincident economic growth remain somewhat robust and resilient, though the trend is down. This is where the usefulness of monitoring the coincident measures of growth ends. They are after all, coincident, lagging, and have thus been priced in long ago. As a result, they provide little information as to the future outlook for the business cycle, which is what matters most to investors. In order to ascertain where the economy and asset prices are heading, both the long and short-leading indicators of the growth cycle must be assessed.
Leading indicators of the business cycle
Using a leading indicator approach to forecasting the business cycle requires the use of a broad number of metrics and indicators of economic activity, whose forecasting abilities range anywhere from three to 18 months. The long-leading indicators are useful because they provide us with a directional outlook for growth and help shift our bias to which general direction the business cycle is likely going, while short-leading indicators are more useful from an asset allocation perspective, particularly when they align with the longer-leading indicators.
Some of the best longer-leading indicators of the business cycle are liquidity metrics. For the purposes of assessing the outlook for the business cycle, my preference is to view liquidity through the lens of the cost of liquidity and the quantity of liquidity.
In terms of the cost of liquidity, I use a diffusion index measuring the movements in the policy rate of the G20 central banks. As we can see below, when the percentage of central banks raising rates increases (inverted below), this tends to lead economic growth by around 12 months or so. The Global Central Bank Policy Index bottomed around the turn of the year, suggesting the US PMI should bottom at some stage in the second half of 2023. It is charts like this which scream policy error. The banking crisis may well be only the beginning.

If we now turn to the quantity of liquidity, here measured by the growth in the M2 money supply for the largest liquidity providers in the global economy (US, China, Japan and Eurozone), this index has too seemingly bottomed in the past month or so. Clearly, the liquidity cycle is beginning to inflect positively, this should bode well for economic growth and asset markets in the latter stages of 2023 and into 2024.

For now however, it is important to remember the lags from liquidity and monetary tightening are long and variable. I suspect we are yet to fully feel their effects.
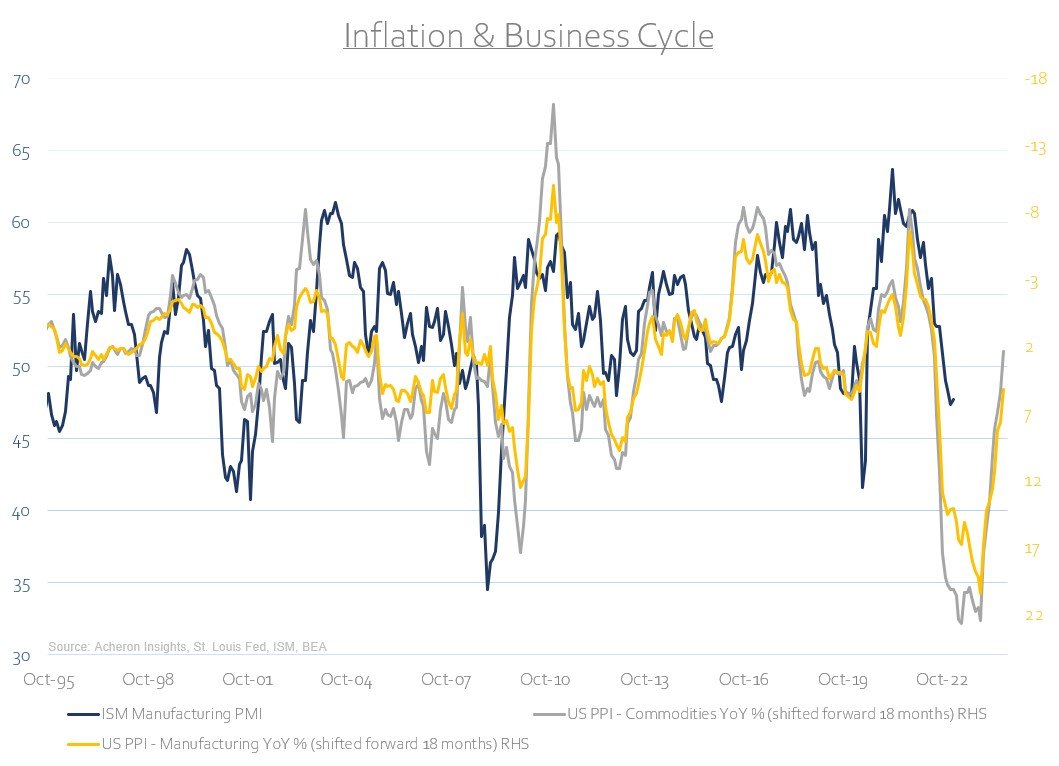
At the heart of this hawkishness and tightening of monetary conditions is of course inflation. This is why inflation itself tends to provide a solid 12-18 month lead on the business cycle. Again, inflationary pressures have eased of late and suggest an uptick in growth in the latter stages of the year and into 2024.
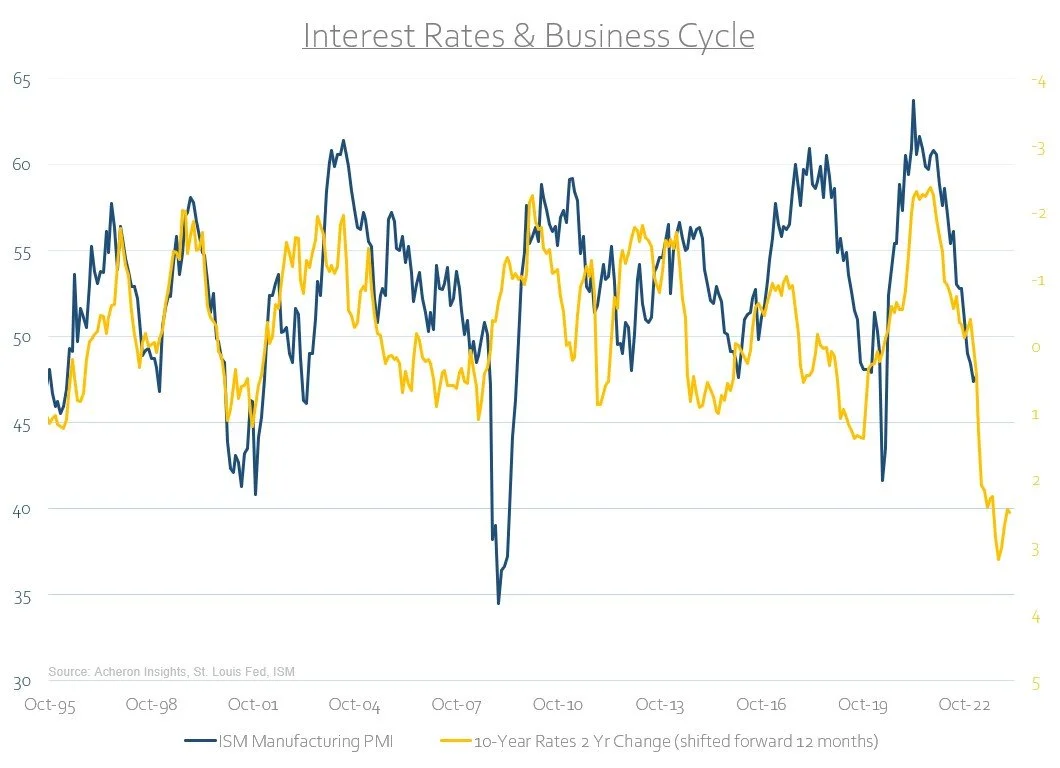
Inflation elicits a response of higher rates and tighter financial conditions. Not only is this true for central bank policy rates, but it is also true of interest rates as a whole and mortgage rates. Although both have seemingly bottomed, we have seen the swiftest tightening of financial conditions in decades, and, it usually takes around 12 months for these impacts to be fully felt.

Unfortunately, it is not just rising interest rates causing stress, but changes in the dollar and energy costs are also highly impactful on economic activity. Higher energy costs (and higher commodities overall) constrain economic activity for both the corporate and household sector for obvious reasons, while a stronger dollar reduces corporate profits for companies conducting business overseas and heavily impacts foreigners’ ability to finance their dollar debts and settle transactions, constraining growth.
Higher rates, a higher dollar and higher energy prices are a recipe for demand destruction. When we combine the three into a financial conditions composite, we tend to get a fairly solid read on where growth is headed over the next nine to 12 months. Again, we have passed peak tightness, but are unlikely to have felt the full impacts as of yet. This financial conditions composite, as well as interest rates, mortgage rates and inflation are all suggesting growth will bottom at some point in Q2 to Q3, or maybe even as late as Q4. Overall, financial conditions seem to be suggesting the PMI is likely to bottom out around the 40-45 level.

We are now seeing signs of the lack of liquidity and tight financial conditions show up in credit markets. Access to credit for both corporations and individuals is becoming increasingly difficult as bank lending standards have tightened materially over the past quarter. This does not bode well for industrial production growth, which tends to lag commercial and industrial tightening standards, as well as retail sales, which tends to lag lending standards for consumer credit loans. Reduced access to credit in the face of negative real wage growth is not an ideal combination for consumption.


Another headwind for the growth cycle over the next couple of months is the inventory cycle. What occurred during 2020 and 2021 was a significant build-up in manufacturing inventories (bullish growth) as manufacturer’s rushed to stock their shelves in response to the release in pent-up demand post-COVID. This has been a material headwind to growth since, and, as we can see below, the inventory cycle suggests the PMI is set to bottom in mid-2023 around the 45 level before inflecting higher into 2024.

Another means to view this dynamic is through the New Orders less Inventories components of the ISM manufacturing survey. This relationship tends to provide a solid short-term lead on the PMI, which again suggest the slowdown in growth is likely to continue in the months ahead.

What also remains a material drag on growth for the time being is the housing market. Put simply, the housing recession is not yet over. This is not good for growth. What’s more, the outlook for the commercial real estate industry is also decidedly poor. Why? Well, aside from the obvious shift to work from home (Manhattan’s office capacity still around one third lower than it was pre-COVID), it is the stress unfolding within the regional banking system that will continue hurt the sector. Regional banks undertake the bulk - roughly 80% - of commercial real estate lending, and with tightening lending standards, deposit outflows and lower share prices constraining the regional banking sector, these trends appear likely to lead to increased defaults as access to credit becomes increasingly difficult. Not a good combination for commercial real estate prices.
In terms of the residential real estate sector, whilst it is on solid footing from a structural perspective (in that mortgage debt serviceability is at secular lows as are loan-to-value ratios), from a cyclical perspective, it also remains a material headwind to the business cycle. When analysing the business cycle, there are few sectors and areas within the economy of more importance and influence than the residential housing market. With housing contributing to around 15-20% of GDP through housing related investment and consumption, understanding the outlook for the housing market is imperative to forecasting the business cycle.
As residential house prices overall continue to be pressured, residential investment - the primary means through which housing contributes to growth - has collapsed. Residential investment tends to lead the business cycle by around 12 months and has yet to inflect higher.

Likewise, housing starts also tend to lead the PMI by around three months, and they too are yet to signal a bottom.

The dynamics within the housing market are yet to find the bottom, and are suggesting the PMI could reach as low as 40-45 at some point this year.
Another clear headwind for growth over the next six months or so is the wealth effect. The relationship between GDP growth and changes in household net worth does an excellent job in illustrating how financialised the US economy has become, and how changes in asset prices (particularly house prices) drive consumption, and thus economic growth.

What are markets pricing in?
While having an outlook for the business cycle is imperative to one’s investment approach, what matters is what asset markets are pricing in. Looking for divergences between the leading indicators of the business cycle and market pricing can lead to very profitable investment opportunities, along with helping investors tactically adjust their allocations to various asset classes in an informed manner.
Beginning with the stock market, at the October 2022 lows, the argument could easily be made that stocks had priced in the any kind of business cycle downturn. In the months since, stocks have rallied materially and as it stands, the broad stock indices are seemingly pricing in a swift rebound in growth. If the leading indicators of the business cycle presented herein ring true and see the PMI bottom around the 40-45 level, it is now becoming increasingly difficult to make the argument stocks have priced in the poor outlook for growth. While I am not necessarily bearish stocks, from a business cycle perspective things are far from clear (as is my actual outlook for the stock market).

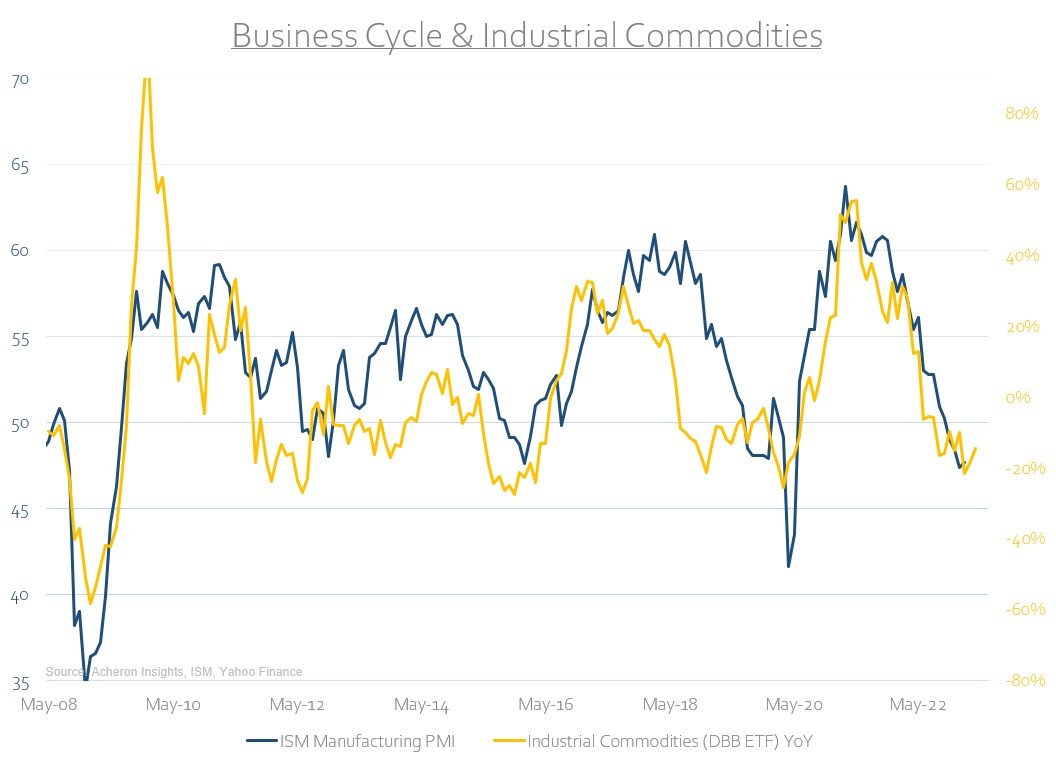
In terms of commodities, both industrial commodities and crude oil have traded lower in-line with the PMI over the past year. Given the leading indicators suggest we could see a PMI reading of anywhere from 40-45 in the months ahead, this does suggest the potential for further downside in energy and commodities as a whole is possible. However, there does remain a possibility that a China reopening will help to put a floor under both, as will the structural supply constraints within the energy sector.

Meanwhile, bond market continues to appear mispriced form a business cycle perspective. Clearly, there are cyclical tailwinds for bonds and headwinds for yields. This is true of both faltering growth and falling inflation.


Credit on the other hand looks vulnerable and also appears mispriced from economic reality. Credit spreads continue to price the PMI above the 50 level.


As do junk bonds.
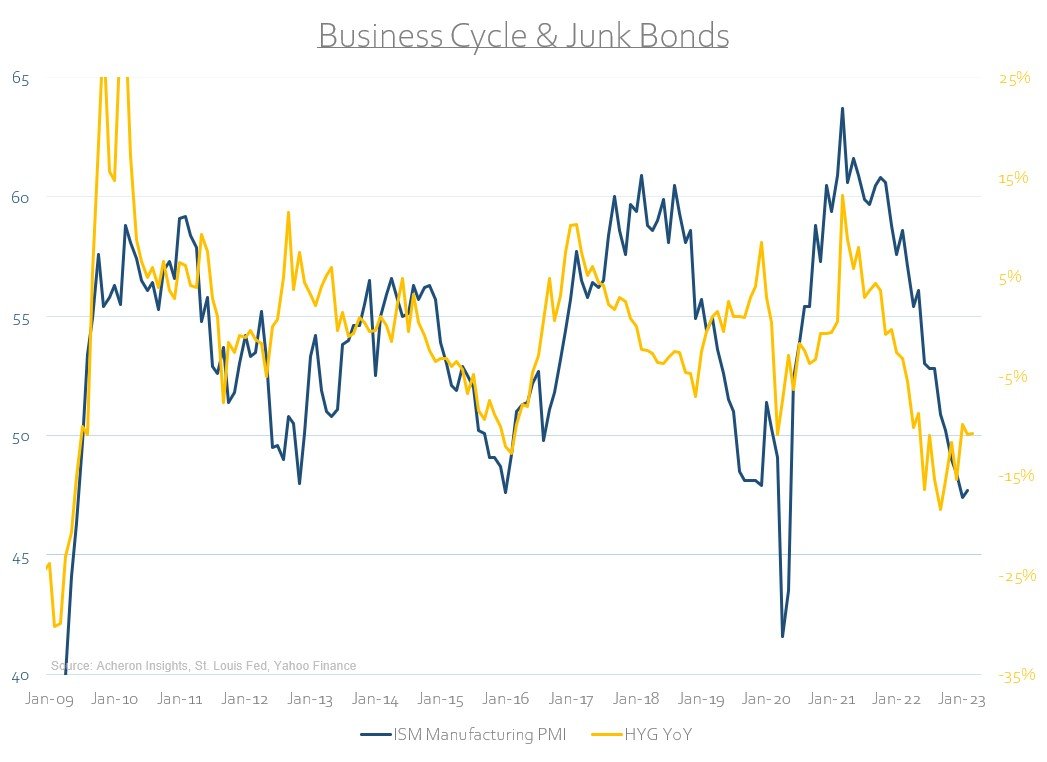
Unfortunately, we are likely only just starting the credit cycle downturn. A macro opportunity in credit seems like it could be on the cards at some point this year.
Summary & Conclusions
In summary, both the leading indicators of growth and liquidity continue to suggest growth will slow as 2023 progresses. The housing market and the inventory cycle in particular are still material headwinds to growth, while we are still unlikely to have fully felt the ill effects associated with the tightening of financial and monetary conditions over the past year. However, we are beginning to see some of the longer-term leading indicators inflect positively, suggesting we will see a bottom in growth at some stage this year which should in turn begin the next growth cycle upturn as we enter 2024.
For now, patience is still warranted for investors, particularly in relation to credit risk, while bonds appear to offer the most upside from a business cycle perspective over the next six to twelve months.
. . .
Thanks for reading!
If you would like to support my work and continue to allow me to do what I love, feel free to buy me a coffee, which you can do here. It would be truly appreciated.
Regardless, feel free to share this with friends and around your network. Any and all exposure goes a long way and is very much appreciated. Thanks again.