Does This Rally Have Legs?
In answer to this question, yes, it appears we are very much amidst a bear market rally. In fact, as I will endeavor to articulate below, it appears said rally could extend further over the coming weeks. As I have discussed much in recent months, we are unequivocally experiencing a growth cycle downturn that is only going to accelerate materially to the downside over the coming quarters. However, for now, it appears as though the stock market may have jumped the gun and as such could offer some respite over the coming weeks. Any such relief would undoubtedly be a gift to investors.
Following the 15% peak to trough fall in the S&P 500, we have since retaken the important 4,300-4,400 level after what appears to be a false breakdown below. From a technical perspective, having so easily retaken this level is certainly a positive outcome for now.
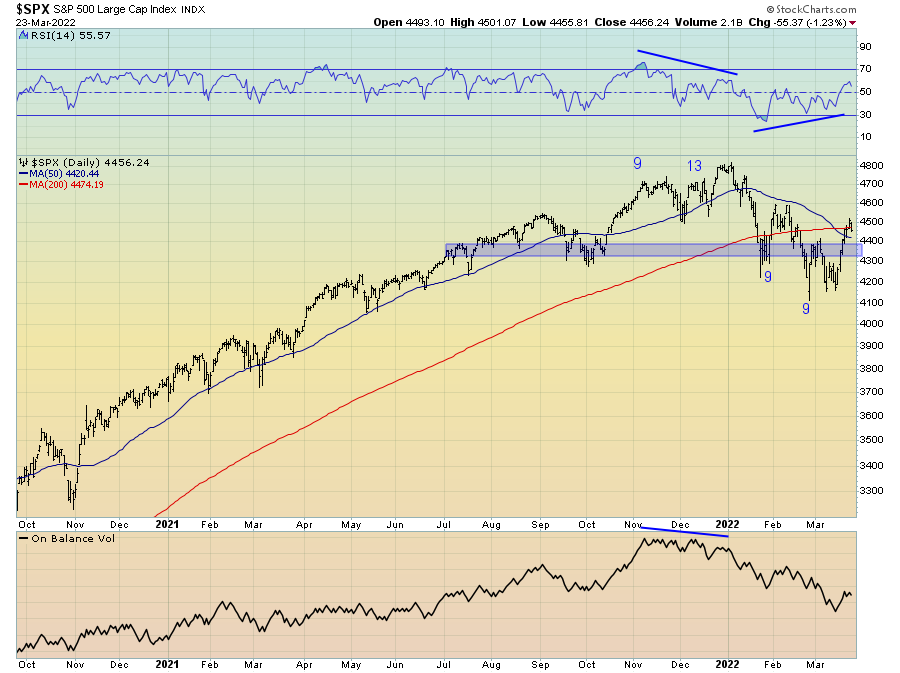
Though I do not expect new all-time highs any time soon, should we be able to hold 4,300 in the S&P 500 and the price action make a higher low, this could help provide a solid base for a continuation of this bear market rally. However, should we rollover and lose 4,300, then the bullish short-term thesis presented herein is likely null and void.
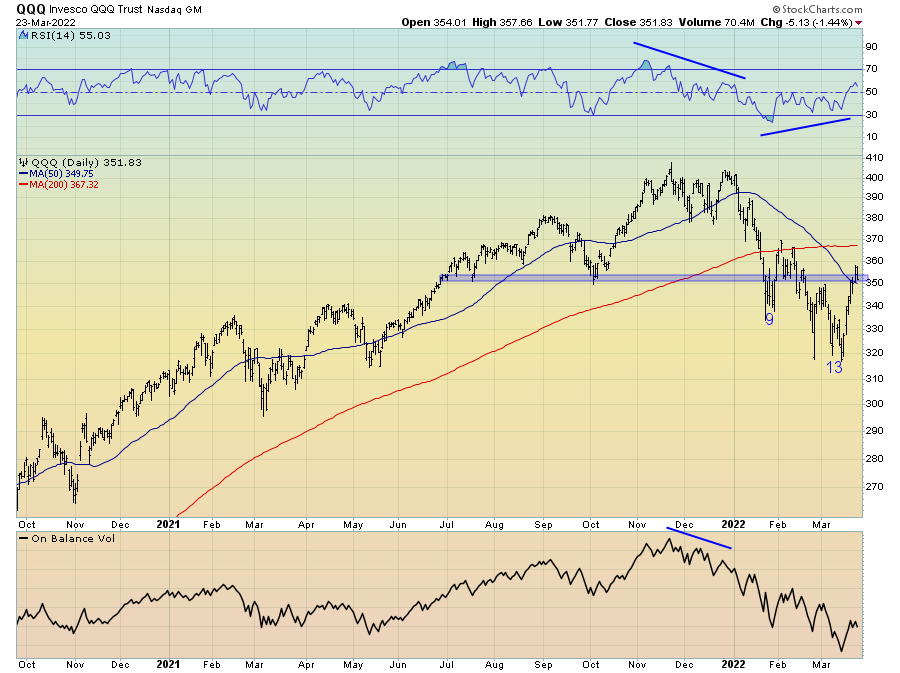
For the Nasdaq, we have seen this rally also retake the important $350 level on the Q’s, which again if held could provide a solid foundation for at the very least a continued consolidation into Easter. I do believe this to be the highest probability outcome over the coming weeks.
Indeed, it is important to remember we are entering the most seasonally favourable period for stocks over the month of April. This period of positive seasonality is particularly prevalent for those stocks and assets of a high-beta and pro-cyclical nature. And yes, whether you care to admit it or not, there are structural reasons in the market why seasonality does matter.
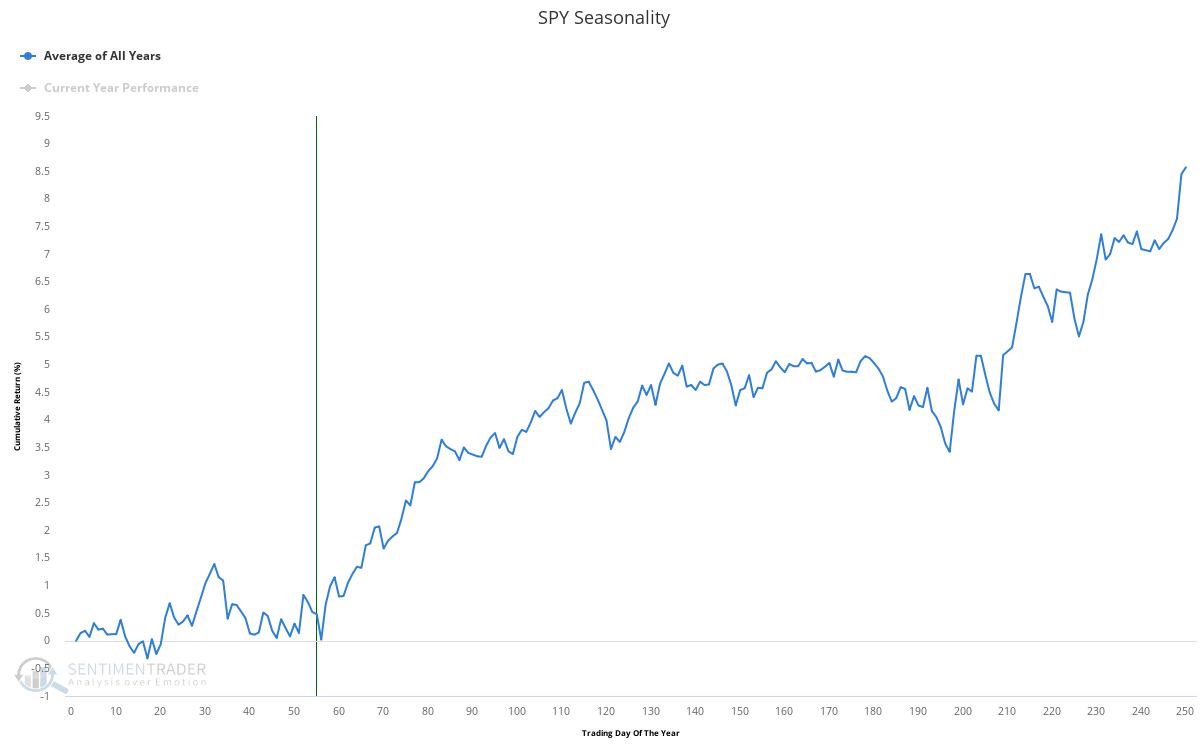
If we look at historical analogs of years past whereby stocks performed in a similar manner to what we have experienced thus far in 2022, we can see how markets have historically rallied out of March through April. Though I am not necessarily a fan of using historical price analogs, it does help provide us with some historical guidance.

What we have so far seen this year is investors seemingly positioning themselves a little too bearish too soon. Per the work of the excellent Darius Dale at 42 Macro, we can see below that when investors are flocking to defensive market sectors (i.e. those who perform best when economic growth is slowing, such as utilities) to such an extreme degree that the purple line enters the consensus fear zone and then exits this area as the market falls (as investors reallocate and buy dips in more pro-cyclical stocks), this has generally been a bullish outcome over the immediate term. Though it is difficult to see below, 42 Macro’s Cross-Asset Correction Risk Indicator has just left the consensus fear zone, a historically bullish short-term outcome in the majority of cases.
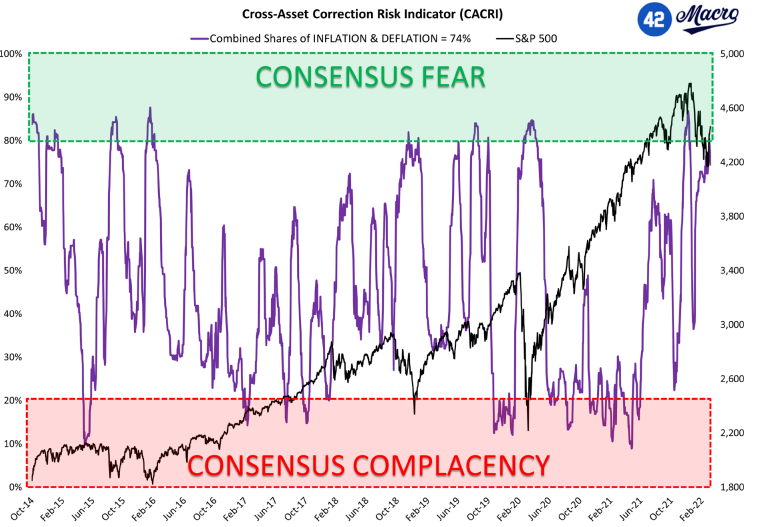
Source: 42 Macro
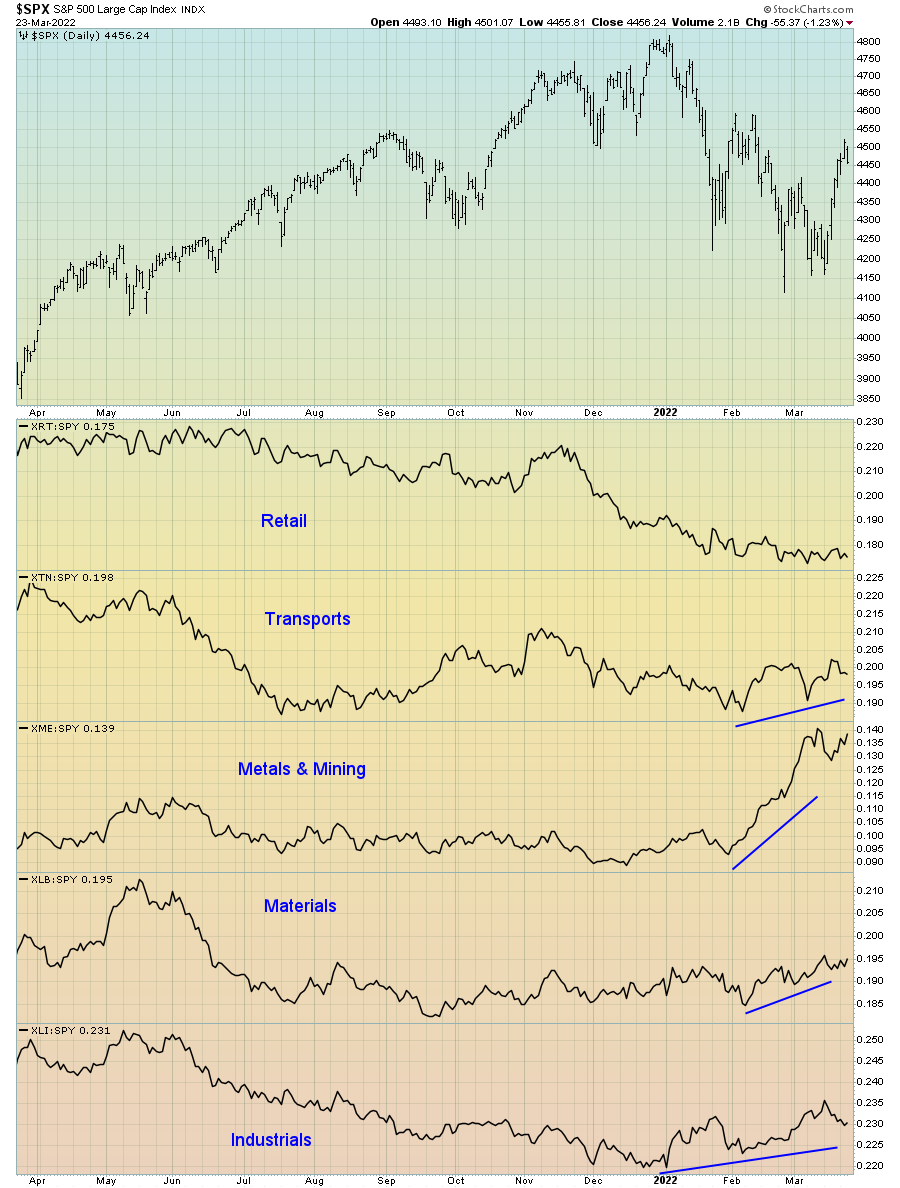
Indeed, we can illustrate this differently by comparing the relative performance of some of the most economically sensitive sectors in the stock market. The retail, transports, metals & mining, materials and industrials sectors were clear underperformers as the market topped in December and have since outperformed, as we can see below. Encouragingly, all of these sectors barring retail appear to be outperforming to the upside amid the current rally. Watching out for relative underperformance of these economically sensitive sectors should the broad market rally continue will help provide us with an excellent indication of when the market may again roll over.
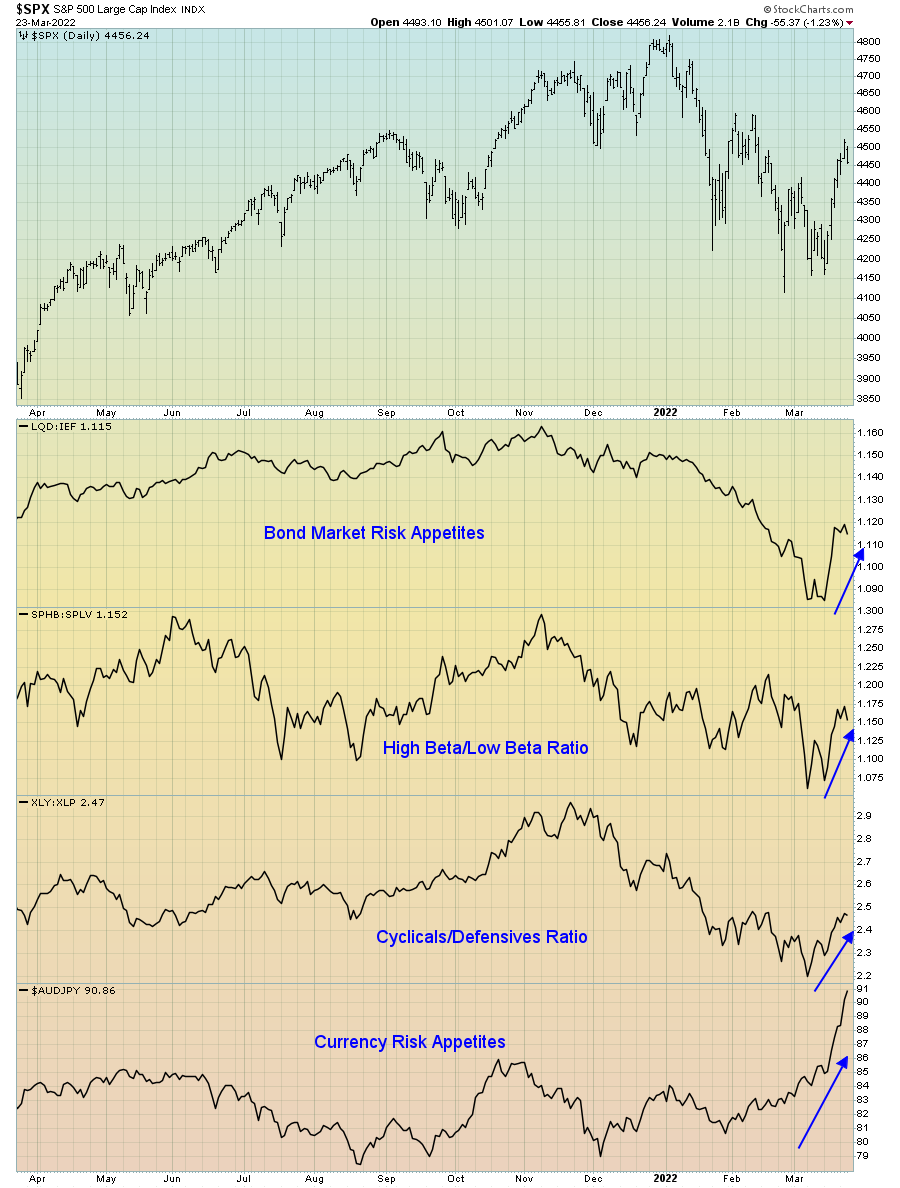
In a similar manner, various risk appetitive measures of investors are too confirming strength to the upside. Again, watch for negative divergences among these investor risk appetite indicators for rally exhaustion.
Also potentially supportive of the stock market for now is net liquidity (as measured below by the Fed balance sheet less the Treasury general account). Net liquidity will become a significant headwind for stocks once the Fed accelerates its monetary tightening and reduction of their balance sheet in May, but for now, stocks look to have gotten a little bit ahead of themselves in pricing in the pending reduction in liquidity.
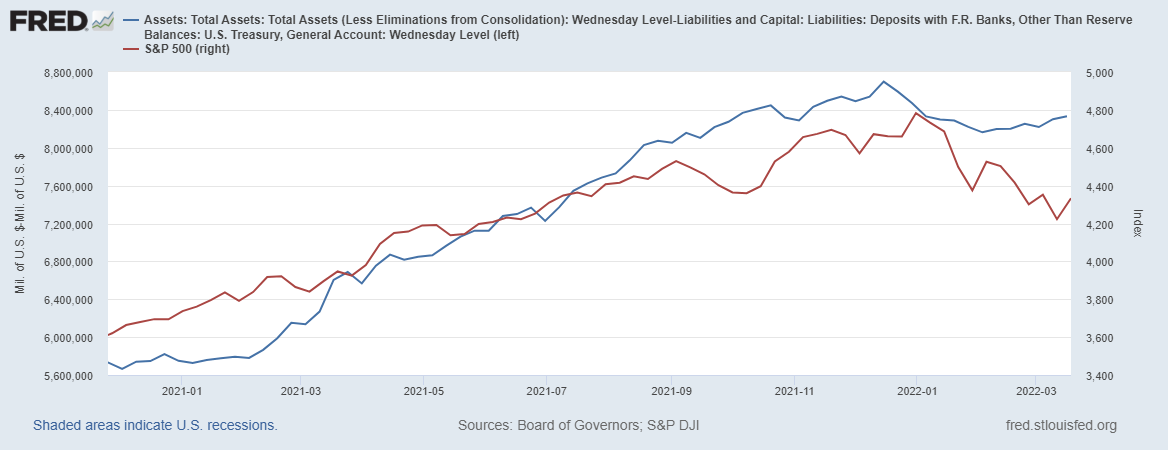
Given how closely the performance of the S&P 500 has tracked liquidity of late, we could see liquidity provide support to stocks over the coming months prior to when the Fed actually starts its taping program in May.
What has also clearly supported (or perhaps more accurately was the direct culprit) of the recent rally was the fact that last Friday’s quarterly options expiry saw roughly 30% of S&P 500 Gamma being wiped from option dealers books. Given we were in negative Gamma territory pre-OPEX, this significant reduction in Gamma positioning resulted in dealers buying-back a significant amount of their short S&P 500 delta hedges, and coupled with bullish Vanna flows as implied volatility collapsed sharply last week helped squeeze the market higher. The tail continues to wag the stock market dog.
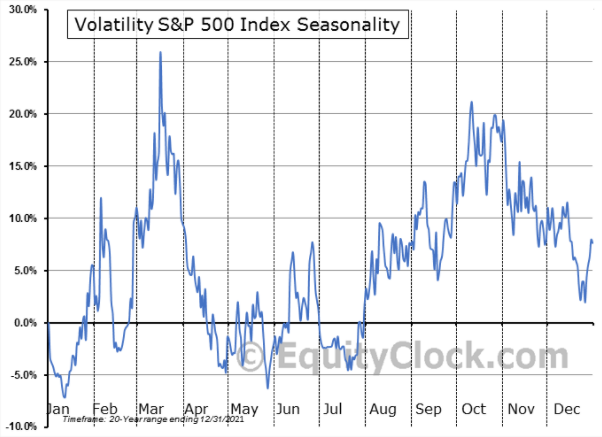
Whether or not we see any bullish Vanna flows from here remains to be seen. The VIX has already fallen to the low 20s and would likely need to go sub-20 to precede significant further Vanna flows. Seasonality certainly favours this outcome as we enter a very unfavourable seasonal period for the VIX. One would however expect implied volatility to remain somewhat heightened given the current geopolitical backdrop and poor economic growth outlook.
As of now, we remain above the short-gamma volatility trigger (per the work of Spot Gamma below) and thus could see a more stable market over the next month, potentially providing the possibility of further positive Vanna and Charm flows into Easter.
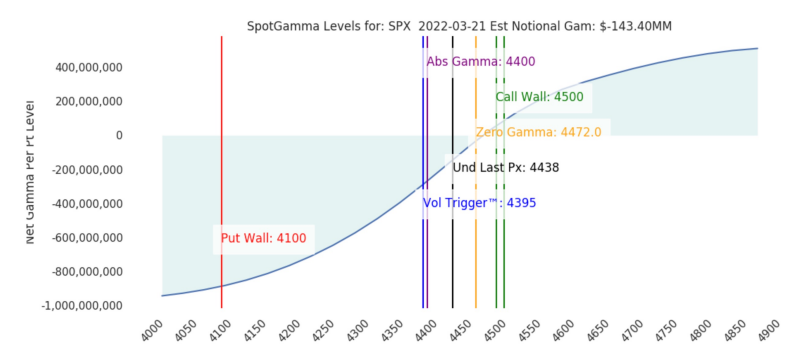
Source: Spot Gamma
However, as investors have given up much of their downside protection following March’s expiry and haven’t replaced this protection over, then if markets were to roll over and continue lower we could well see a significant pick-up in put buying as investors seek to protect their downside. This may reflexively then result in a continued move lower as dealers would need to delta hedge their books by selling the underlying against their short put positions, such is the power of the options markets on stocks these days. Should such a scenario unfold then the put wall around 4,100 looks to be the next major support level.
The fact that dark pool activity for the S&P 500 has seen its most bullish period over the past month since early 2020 certainly leaves me with a bullish bias over the next few weeks. Similar dark pool readings in the past have provided a tailwind for forward 30-60 day returns.

Source: Squeeze Metrics
Likewise, there remains a record number of corporate buyback authorisations set to enter the market this year, a dynamic which could again help provide support to markets over the next month or two before the growing headwinds in slowing growth and monetary tightening drag down markets.
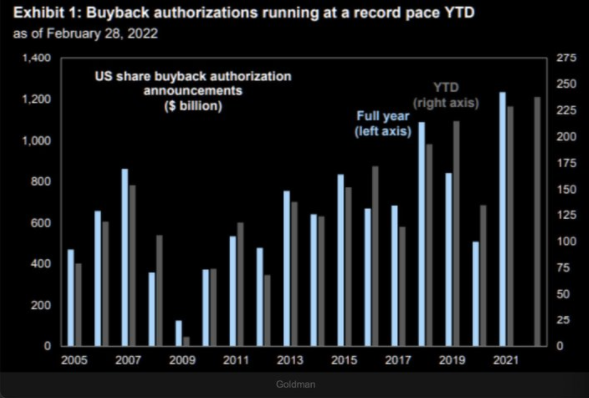
Source: Goldman Sachs
Clearly, whilst I do believe we are amidst the beginnings of a bear market in stocks that could encompass much of 2022, there is evidence to suggest this current rally could continue or at the very least consolidate over the next few weeks. Whilst I am not championing for an opportunity to go tactically long, further strength in stocks presents an opportunity to take profits and accumulate cheaper hedges as implied volatility continues lower.
Summary and key takeaways
Barring a significant news event or external catalyst, stocks seemingly have the potential to continue to rally into Easter during what is a seasonally favourable period. The May FOMC meeting could be the negative catalyst that ushers in the next wave lower as the Fed becomes more aggressive with their tapering plans.
As a result, any prior continued rally would be a gift given the particularly bearish economic and fundamental outlook for the second half of 2022. Should implied volatility also continue lower over the coming weeks, this would allow investors a golden opportunity to add additional downside hedges.