Crypto Market Outlook: Tough Times Ahead, Part Deux
Volatile is the best word to describe the price action in crypto markets of late. Through a combination of the disastrous geopolitical landscape, slowing economic growth and impending central bank tightening, the price swings in such high-beta risk assets as crypto have been extreme. It is a difficult environment out there.
Not a whole lot has changed in my crypto outlook over the next few quarters since my most recent post on the subject. Most notably due to the deteriorating macro environment, I remain bearish over the medium term. However, we are beginning to see some positive on-chain developments of a longer-term nature which should be encouraging for longer-term bulls. For the sake of positivity, such developments will hence be the focus of this article.
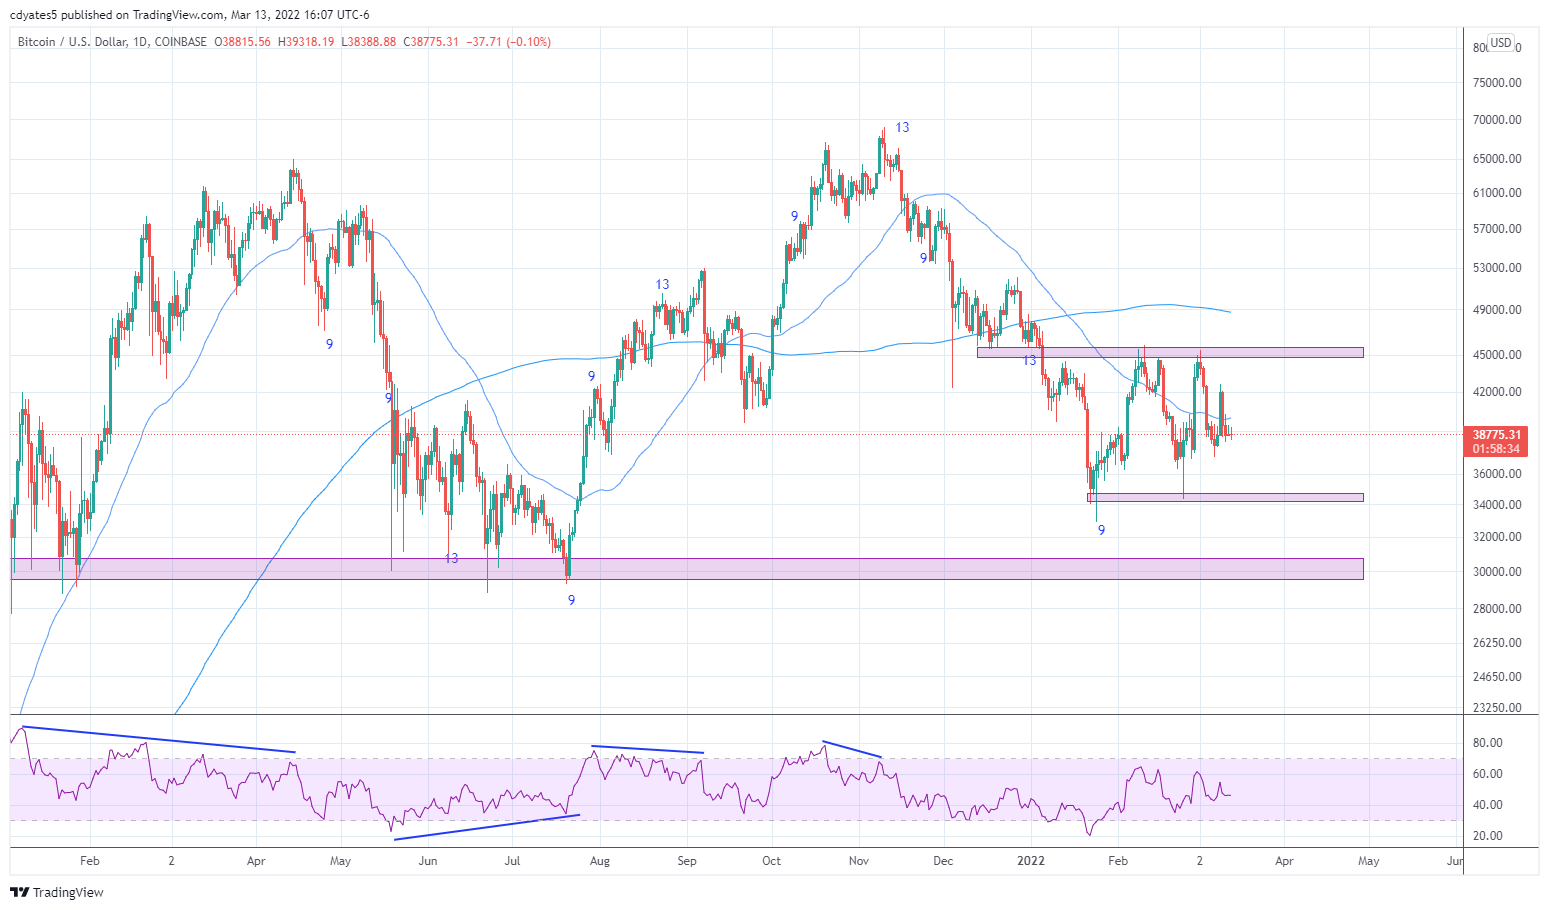
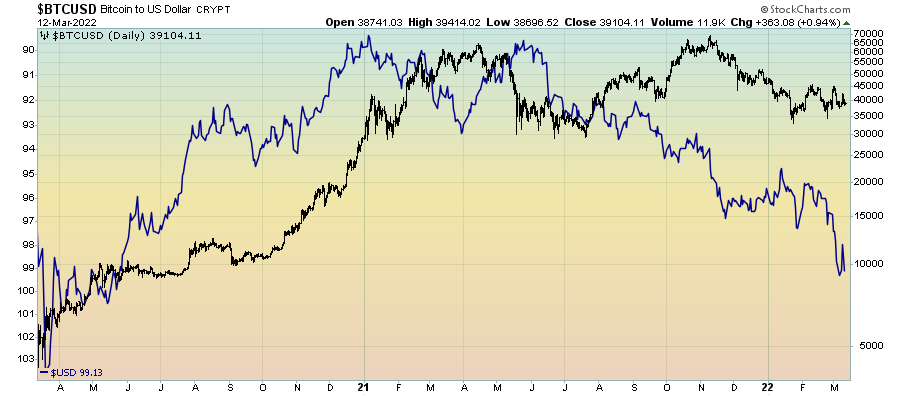
Starting with the technicals however, the daily chart for BTC shows just how volatile the market has been of late. We have now had multiple rejections at both the $45k resistance level, but also the $34k support area. Short-term, these are the levels investors should keep an eye on. Should we break below $34k, then $30k seems inevitable and should be bought, whilst conversely, a break above $45k would have me reconsider by bearish tilt and could be the impetus for crypto’s macro decoupling.
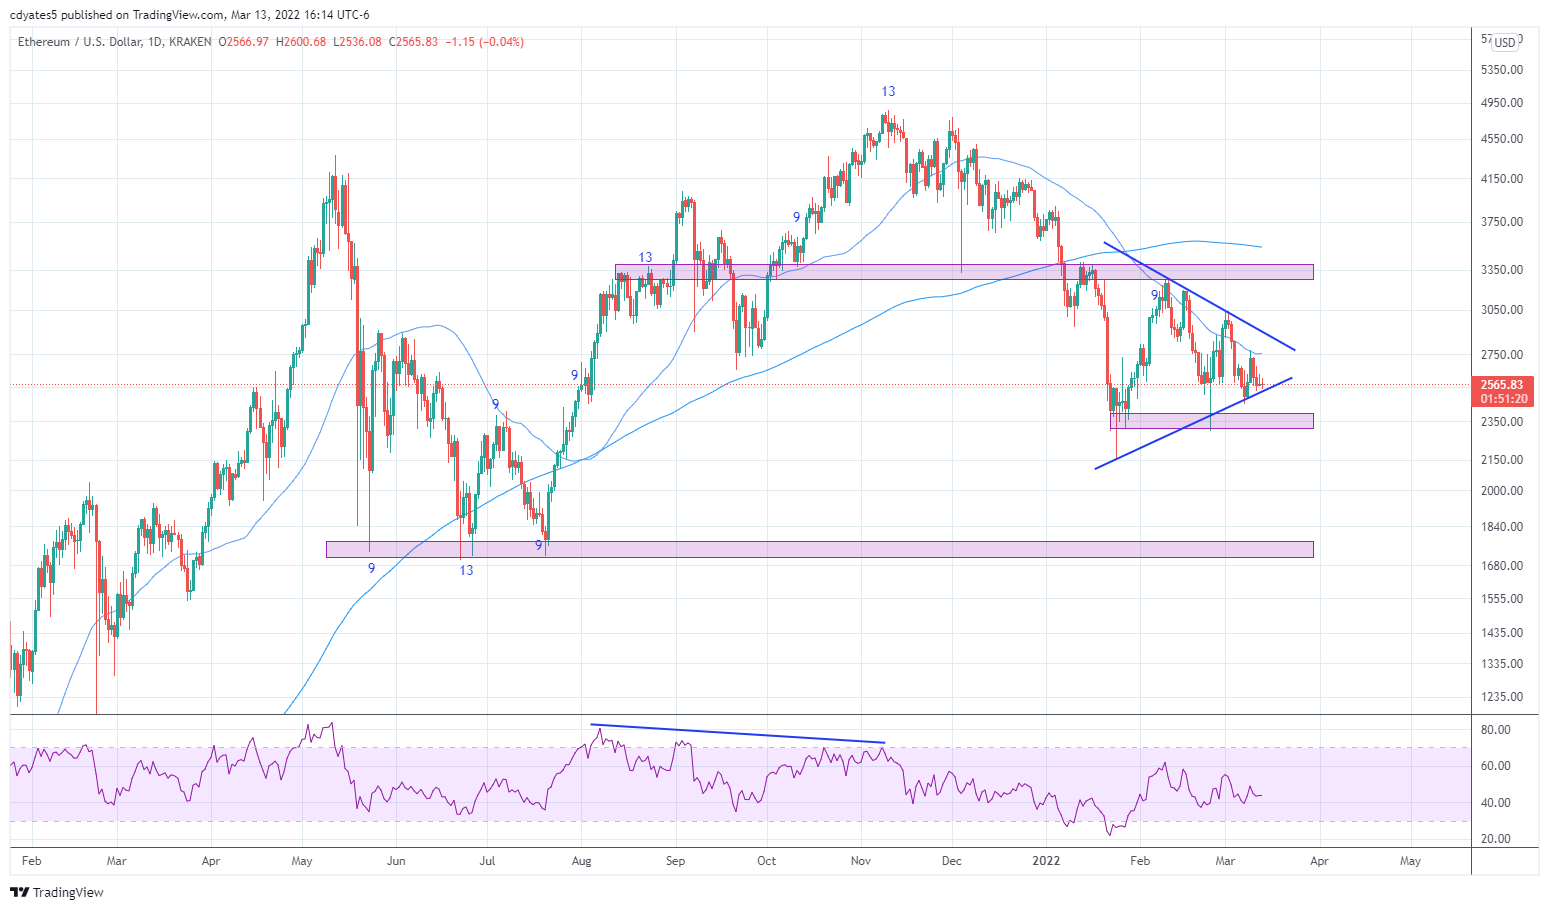
For Ethereum, the price action is looking somewhat precarious and is seemingly readying to make a move one way or another. $2,350 remains support whilst $3,350 is the key resistance area to watch. Should we break below $2,350, $1,700 looks like a reasonable proposition and again would represent an excellent long-term buying opportunity. There is however more downside for ETH relative to BTC at present.
Turning back to Bitcoin via the weekly chart, it is looking more and more likely that we at least test the $30k key support level at some point this year given the unfavourable macro backdrop. Again, as I have repeatedly stated in the past, $30k would be an absolute must buy opportunity for those bullish crypto long-term.
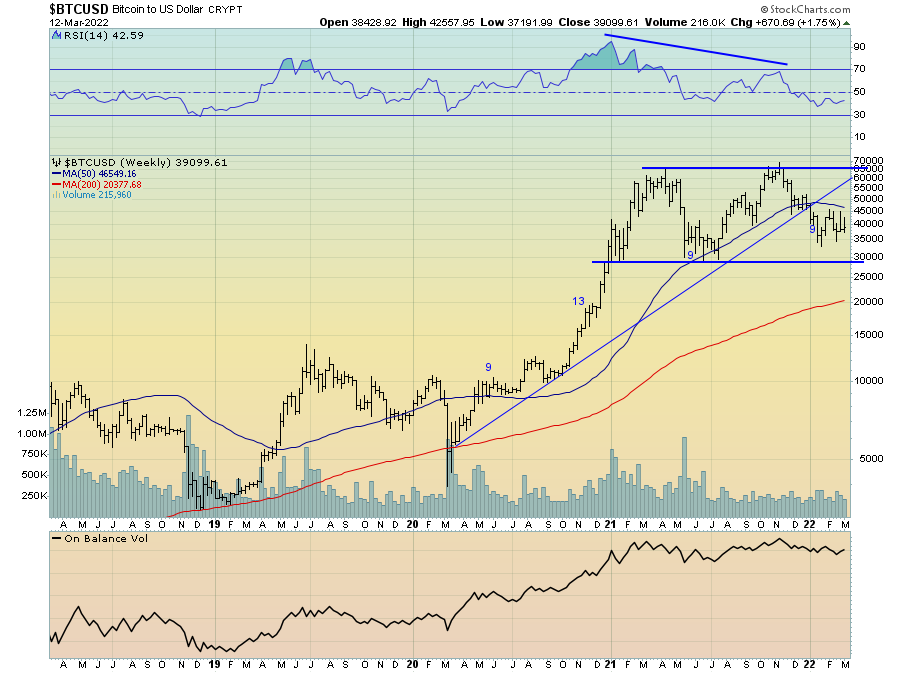
What makes the $30k area of even more importance from a technical perspective is this level is roughly equal to the 61.8% Fibonacci retracement of the entire bull run off the March 2020 lows. Should we be unable to hold $30k, the 200-week moving average looks to be the next key area given there is no support between $30k and $20k. Though painful, such a move would be consistent with previous bear markets and would again represent an excellent long-term buying opportunity.
What makes me increasingly wary that the low is not yet in for 2022 is the fact that we are yet to see a capitulation style spike in volume that has occurred at all the recent lows in late 2019, early 2020 and mid-2021, as we can see in the chart above. Though not a prerequisite for a market bottom, such a capitulation-like spike in volume helps to give us confidence for when such a bottom may be near.
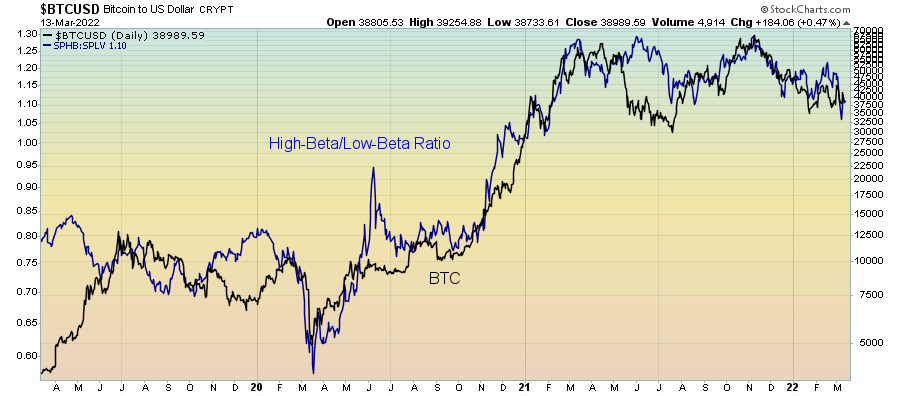
Given the incredibly unfavourable macro outlook set to weigh down crypto assets over the coming quarters, it is difficult to see Bitcoin, Ethereum or any other crypto assets making a sustained move higher in the immediate future. What we know during growth cycle downturns is that high-beta stocks underperform low-beta stocks, and, whether we like it or not, crypto has by and large traded in-line with high-beta risk assets for quite some time know.
What we also know that occurs historically during a growth cycle downturn is the strength in the US dollar, which in times of stress becomes the ultimate safe haven asset, if only out of necessity and foreigners scramble for dollars. Whilst Bitcoin and crypto can clearly still appreciate in value when the dollar rallies, a strong dollar environment is a significant headwind for risk assets. What’s more, the geopolitical tension we are seeing today will only exacerbate this dynamic.
Eventually, we will see crypto undergo a macro decoupling, but for now, the growth outlook remains a significant headwind.
Longer-term developments
Turning now to the aforementioned longer-term developments in the crypto space, we are most certainly beginning to see some constructive signs for those who are bullish crypto long-term, as I am.
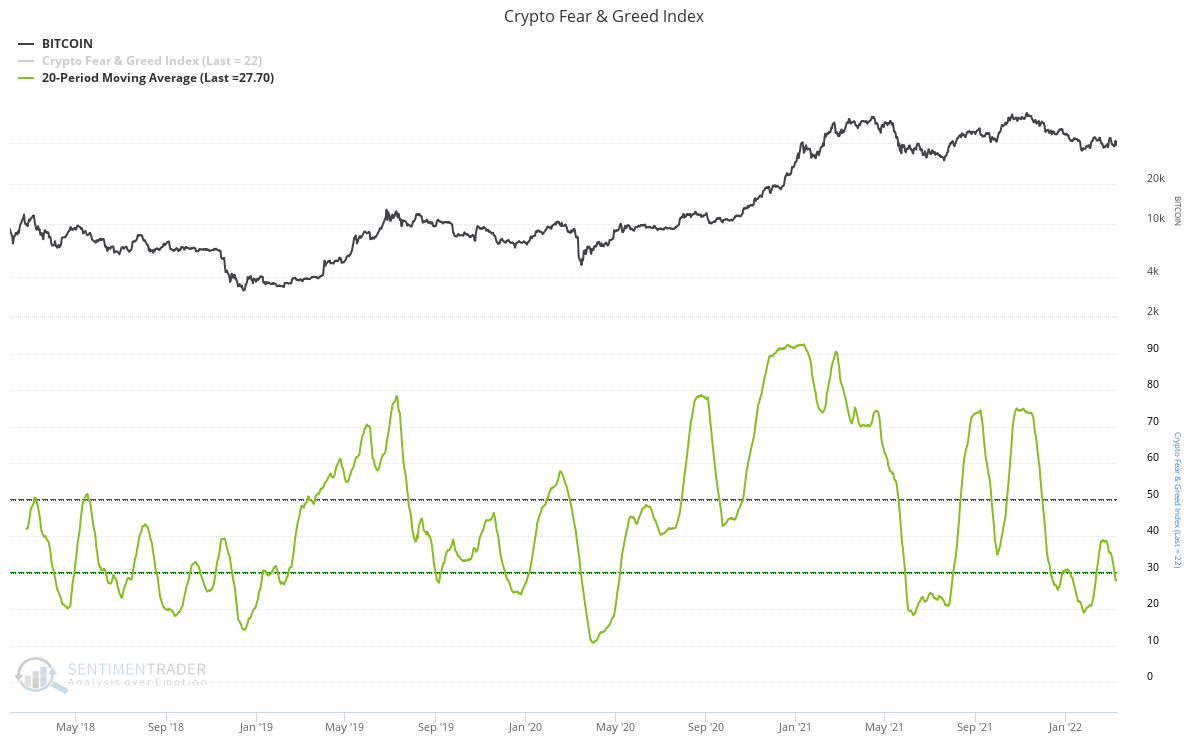
Firstly, we can see sentiment is slowly but surely reaching levels of extreme fear. It is important to keep in mind however that sentiment can stay both euphoric and fearful for extended periods of time, hence why I prefer using a 20 or 50-period moving average of sentiment indicators such as the Crypto Fear & Greed Index below. Sub-20 readings for the 20-period moving average look to be excellent opportunities to slowly deploy ones capital.
In terms of the derivatives space, open interest has reduced significantly since the November high to a level more indicative of a stable and less leveraged market, though open interest still remains at levels higher than we saw during the lows in the middle of 2021. It appears there is still some remaining speculation needing to be flushed out of the system before we can confidently say the low is in for now.
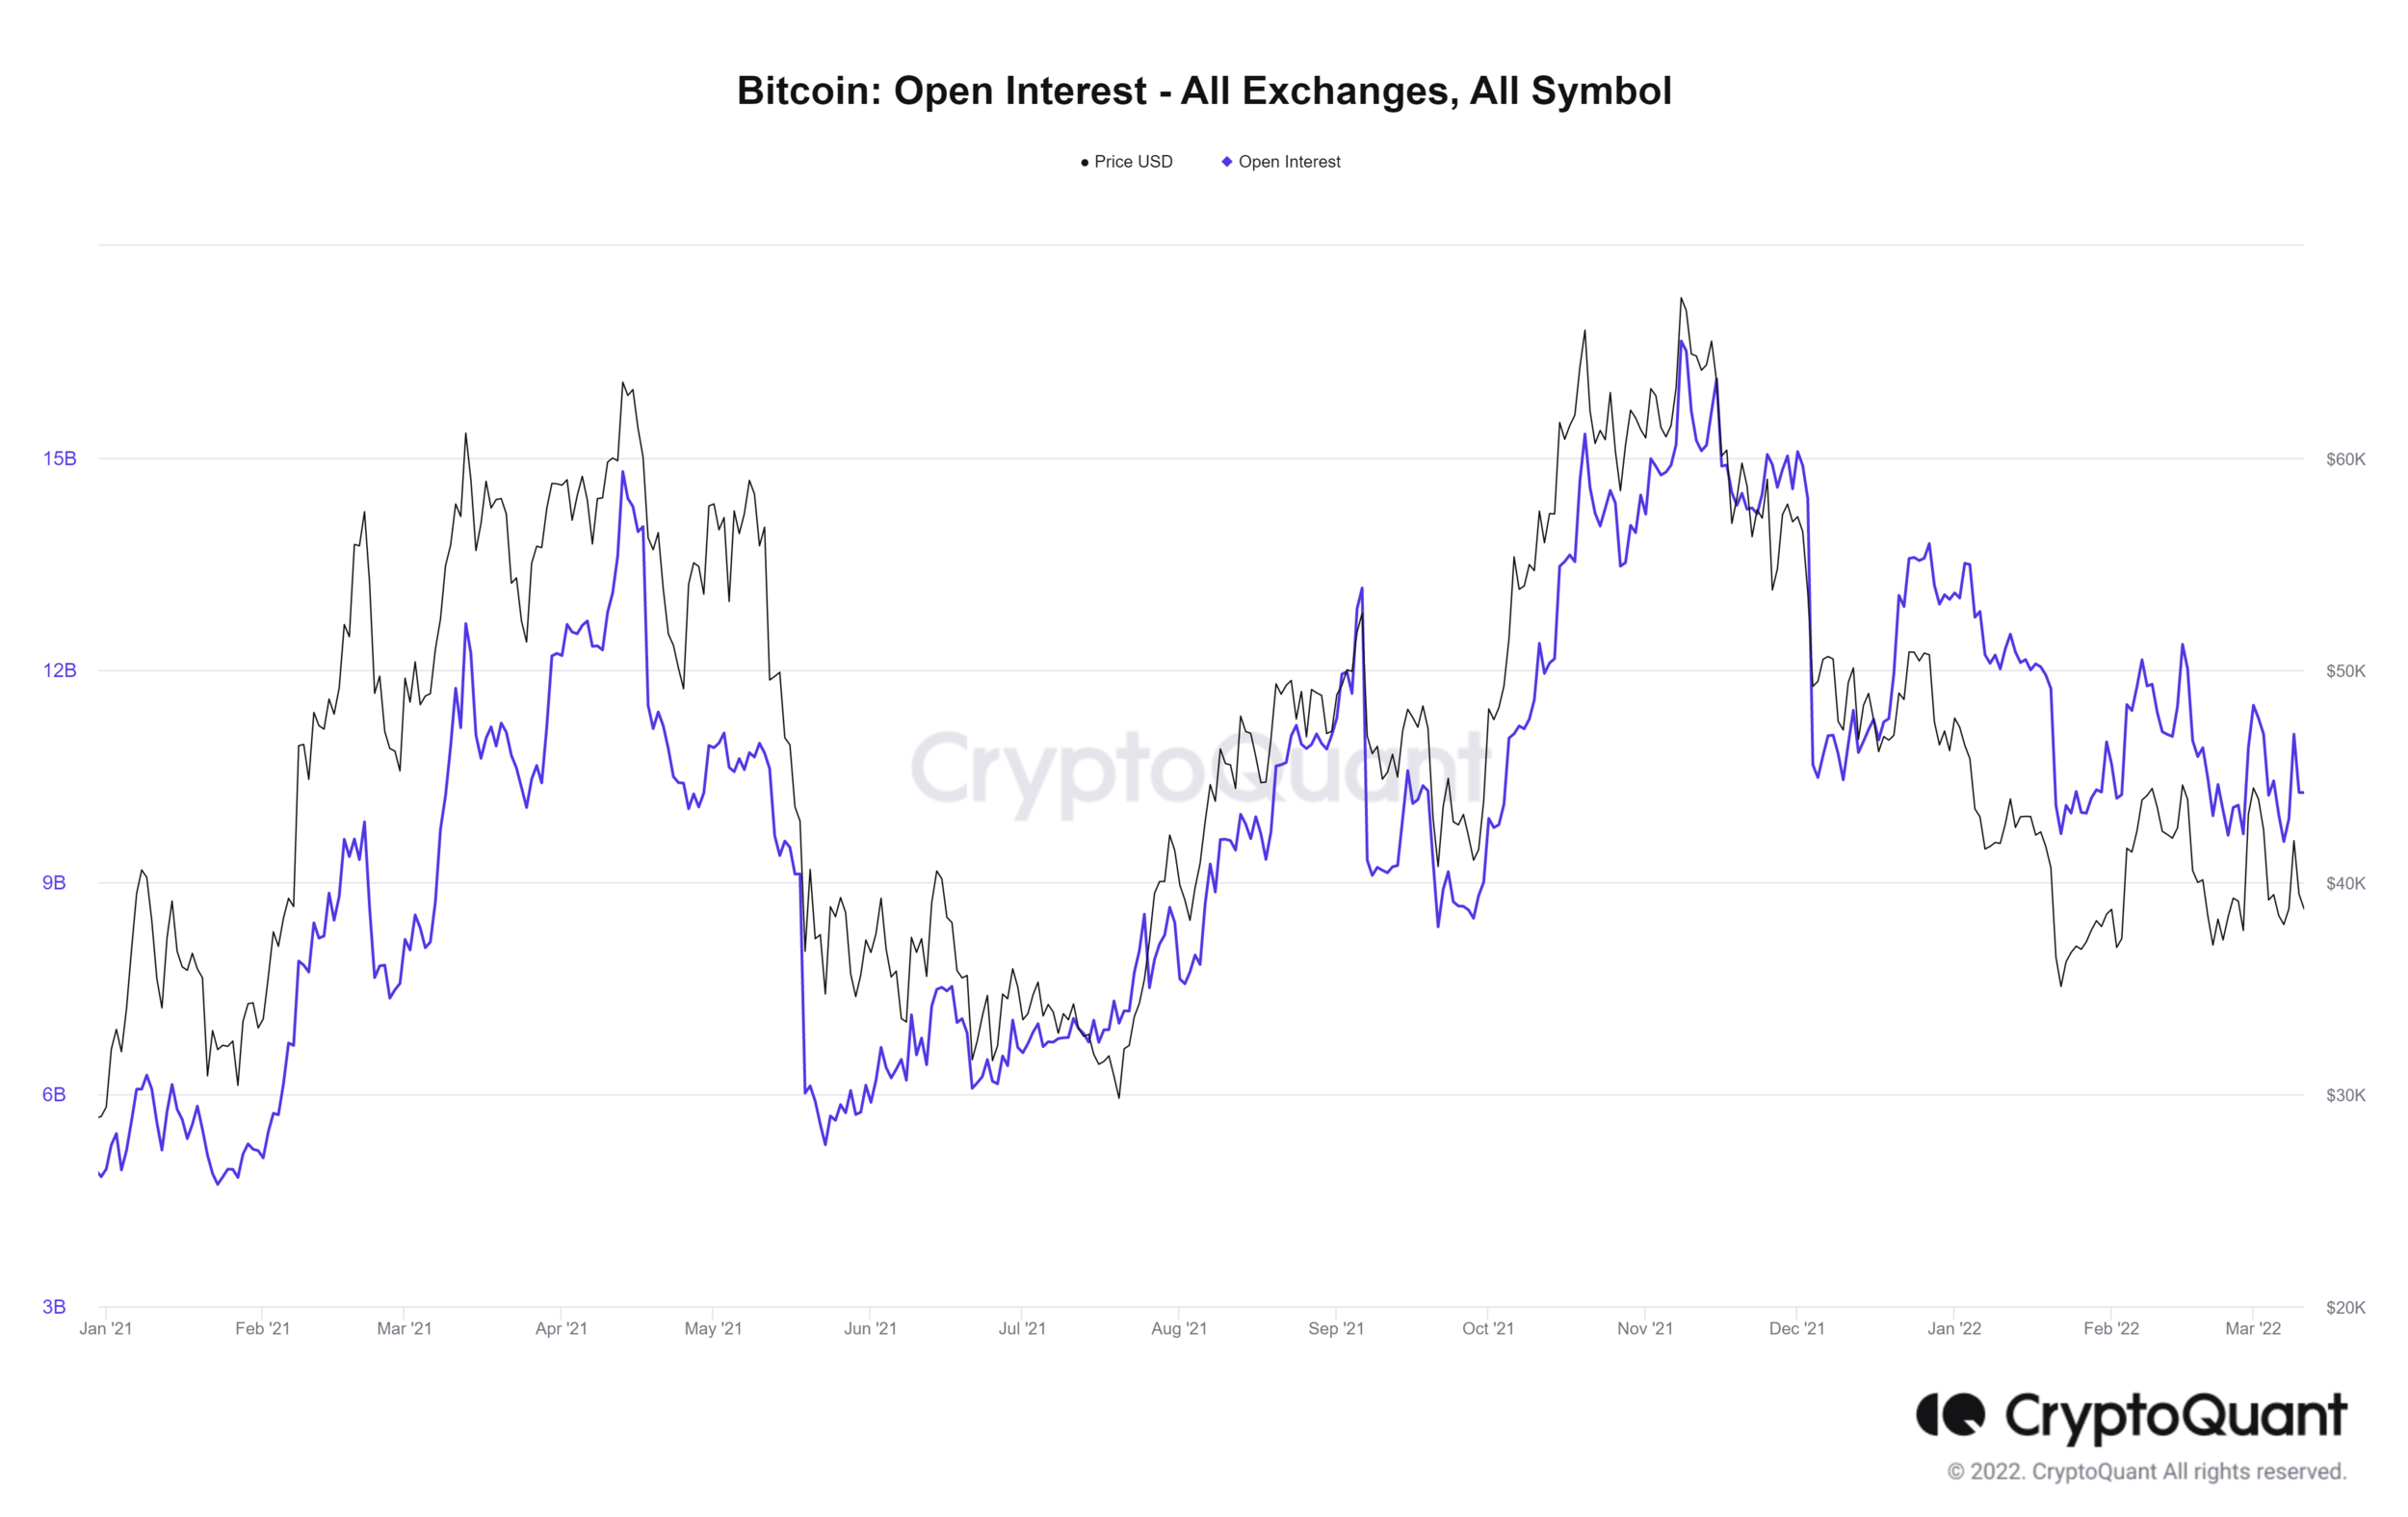
Source: CryptoQuant
Funding rates however are now largely neutral, clearly showing signs that speculators have somewhat reigned in their leveraged positions.

Source: CryptoQuant
From an on-chain perspective, the Market Value to Realised Value (MVRV) ratio below has too dropped significantly of late, exceeding the lows we saw during mid-2021. The MVRV ratio serves as a rough proxy for the average profit/loss position of BTC holders, and has been cited by many as an important long-term valuation indicator for crypto. Clearly however there is still room for this ratio to fall further to the downside, with readings below one generally considered to be excellent long-term buying opportunities. Such an outcome is possible this year and would be very opportunistic.
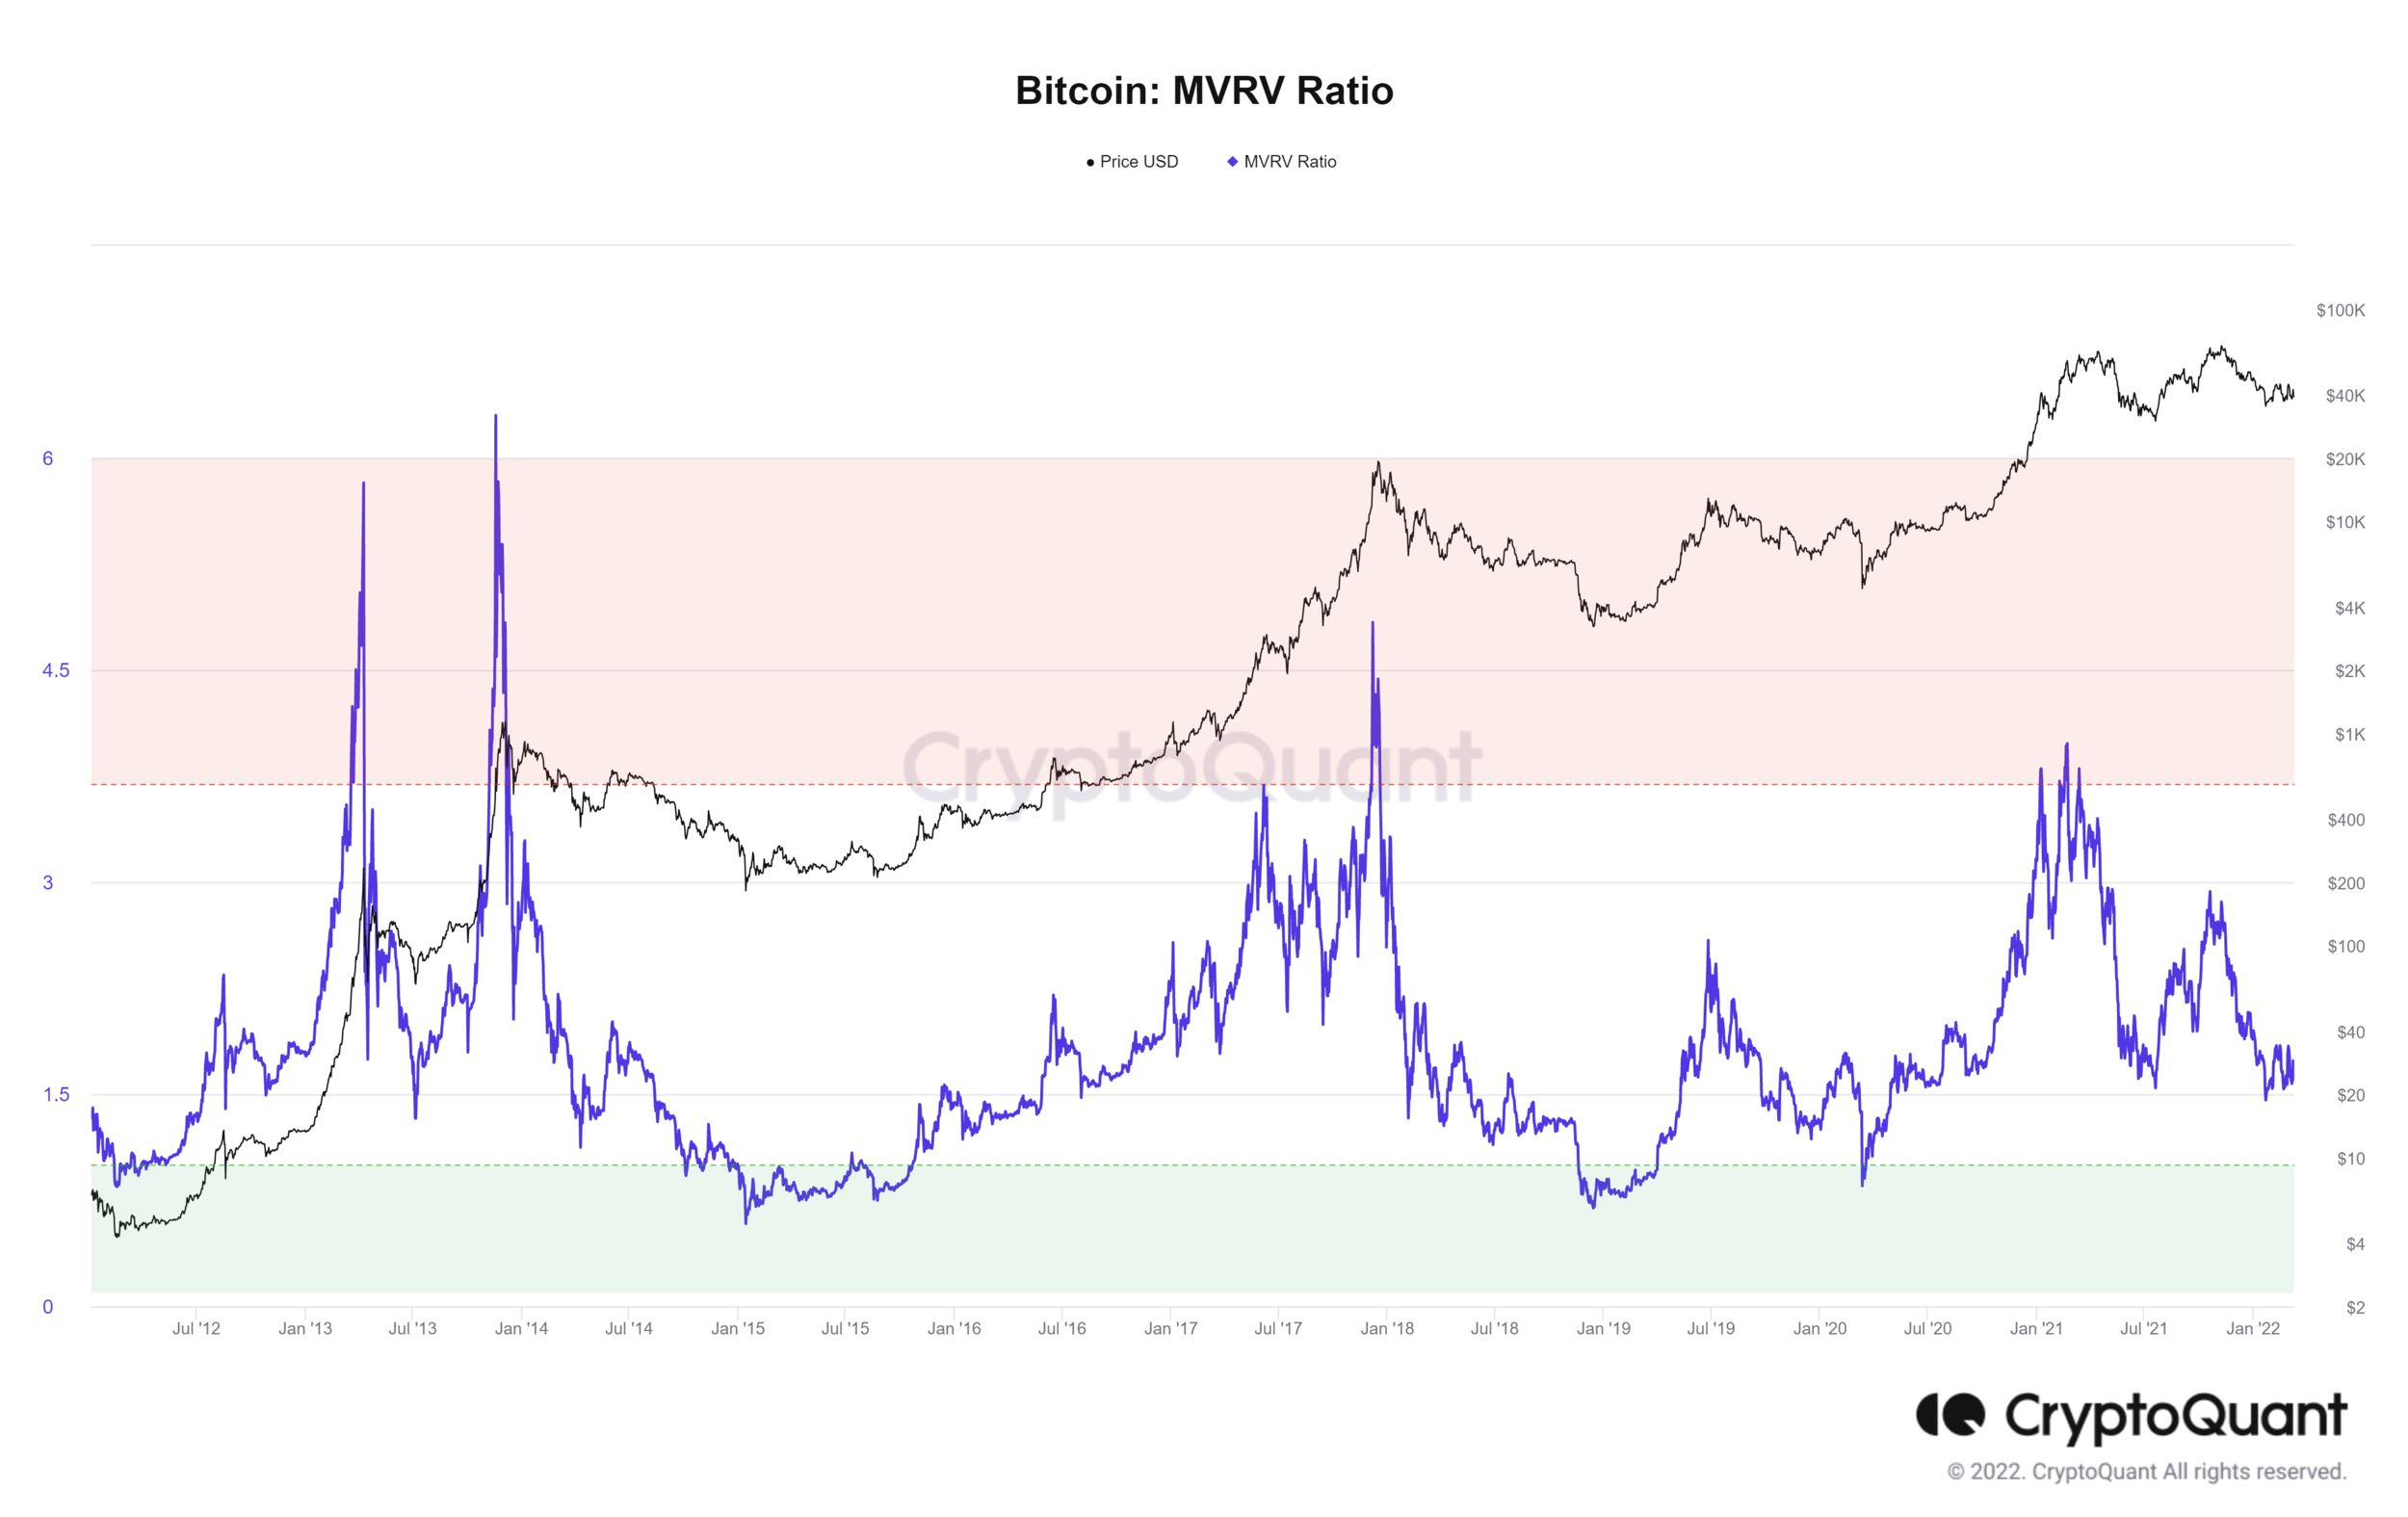
Source: CryptoQuant
There is much positivity to be gleaned from the recent movements of long-term buyers. Firstly, buying activity of whales picked up significantly in January and February as the price has tanked to sub-$40k. Quite simply, if you are a long-term holder, you want to be buying when the whales (i.e. the smart money) are buying. The red and orange dots below indicate whale buying whilst the blue dots whale selling, courtesy of Ecoinometrics.
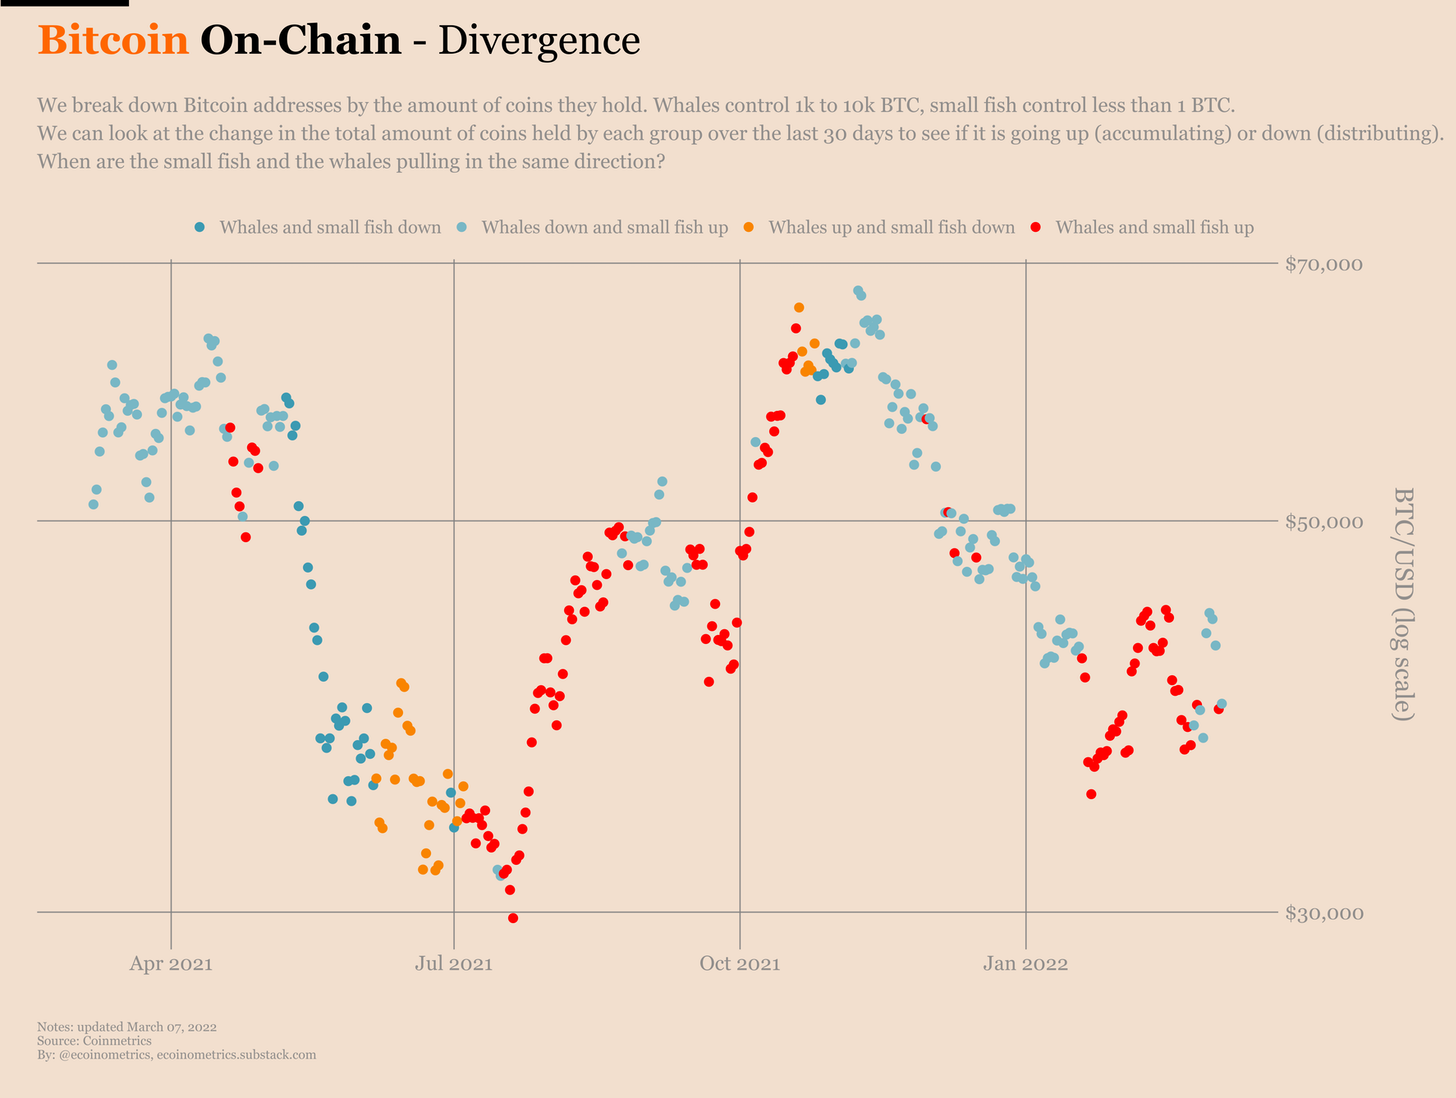
Source: Ecoinometrics
Extending this observation through the distribution of ownership, we can see how long-term holders (represented by the blue to green colours below) are slowly starting to increase their ownership percentage of outstanding supply, a dynamic noted within a recent piece from IntoTheBlock:
“Bitcoin distribution cycle — Bitcoin holders tend to follow a pattern based on price activity and new vs old entrants dominating. It goes something like this:
1. Price rises attracts new entrants, which leads to further price increases
2. Speculation gets out off hand as short-term holders (pictured in red and orange above) rush in while long-term holders sell and create the top
3. Price crashes, with many of the new entrants exiting with losses
4. Long-term players buy in again and accumulate a larger share of holdings
Right now, we seem to be between step 3 and 4, with Bitcoin hitting an all-time high in November and short-term traders dropping as much as 32%. Simultaneously, long-term holders are starting to increase their share of supply as shown by the black arrows in the UTXO age indicator.”
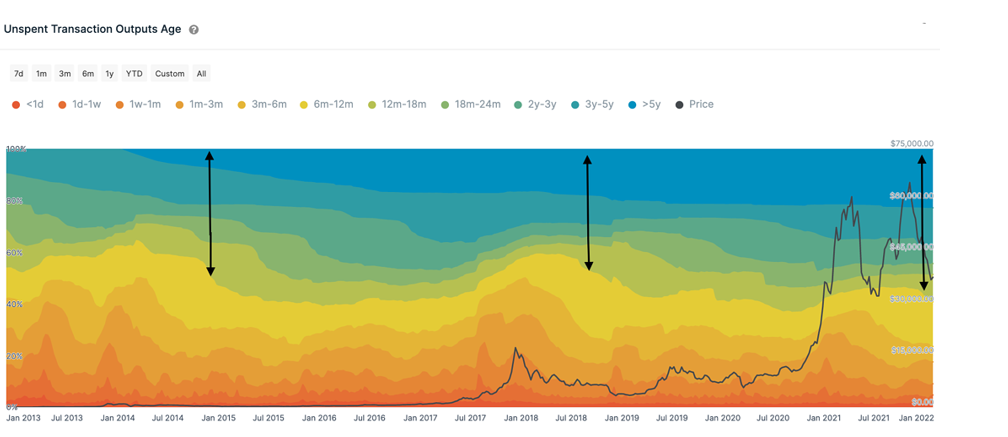
Source: IntoTheBlock
We can also see this same dynamic illustrated below (blue line), as the percentage ownership of outstanding coins by long-term holders is increasing, a trend historically associated with periods of crypto weakness but indicative of attractive buying opportunities for said long-term holders.
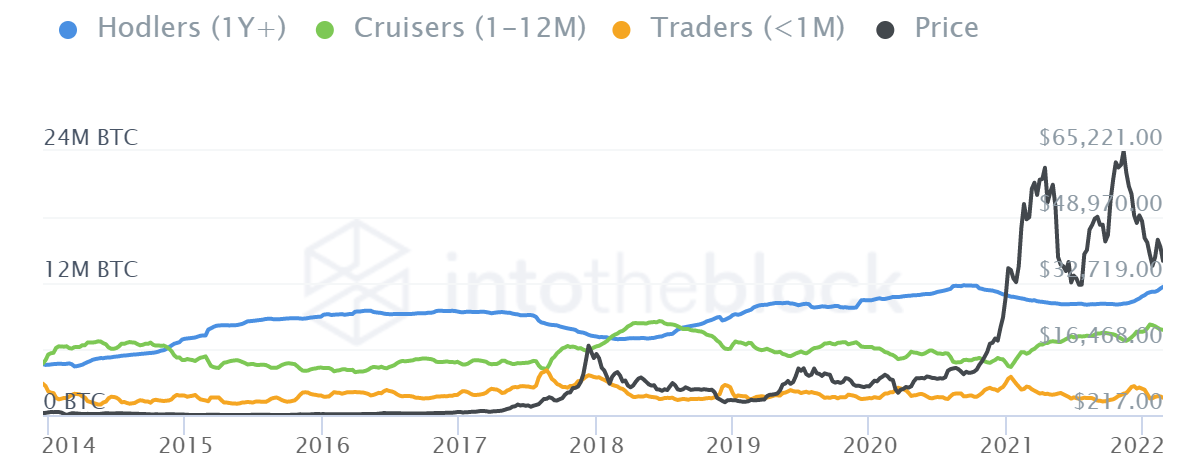
Source: IntoTheBlock
Positive longer-term signals for the various on-chain data are seemingly beginning to pop-up all over the place. Indeed, the Reserve Risk indicator looks to be finally entering an area representative of favourable long-term buying opportunities, though I would like to see this metric fall a little further before I become too optimistic. Reserve Risk is a measure of the price relative to the HODL bank, and is used to assess the confidence of long-term holders.
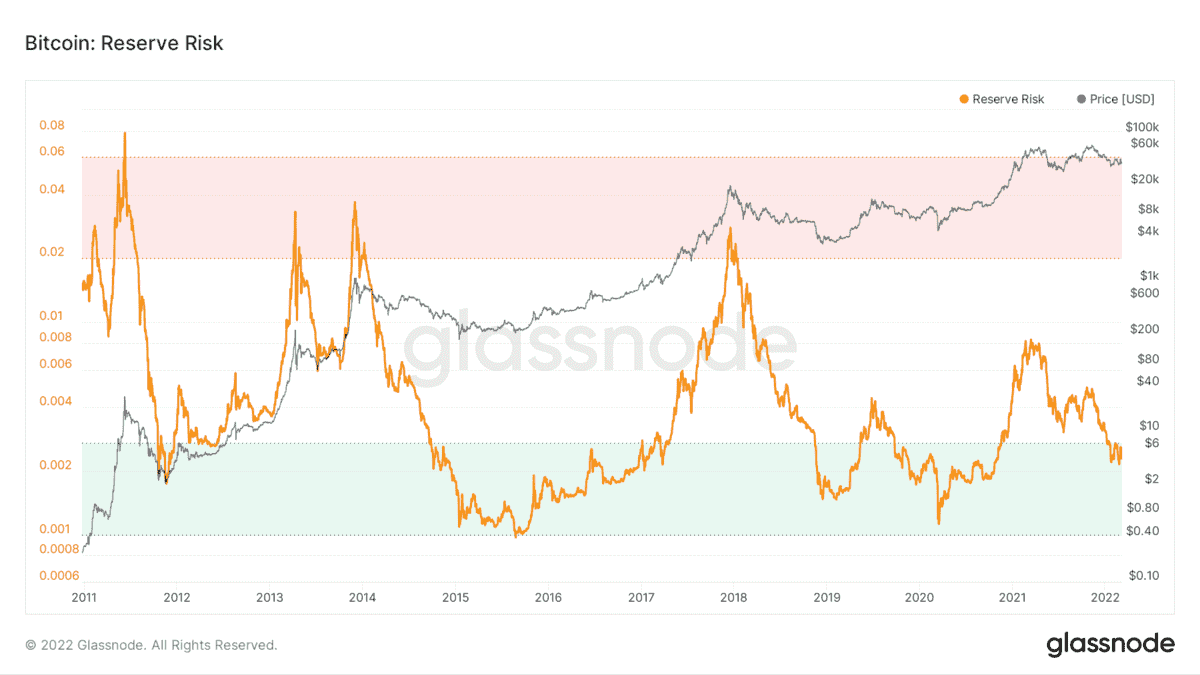
Source: Glassnode
Likewise, Dormancy Flows, measuring the ratio of market capitalisation and the annualised dormancy value, is too nearing the long-term buy zone.

Source: Glassnode
As is the percentage of transfer value in profit (as measured by the 90-day moving average), a development recently noted by Glassnode.

Source: Glassnode
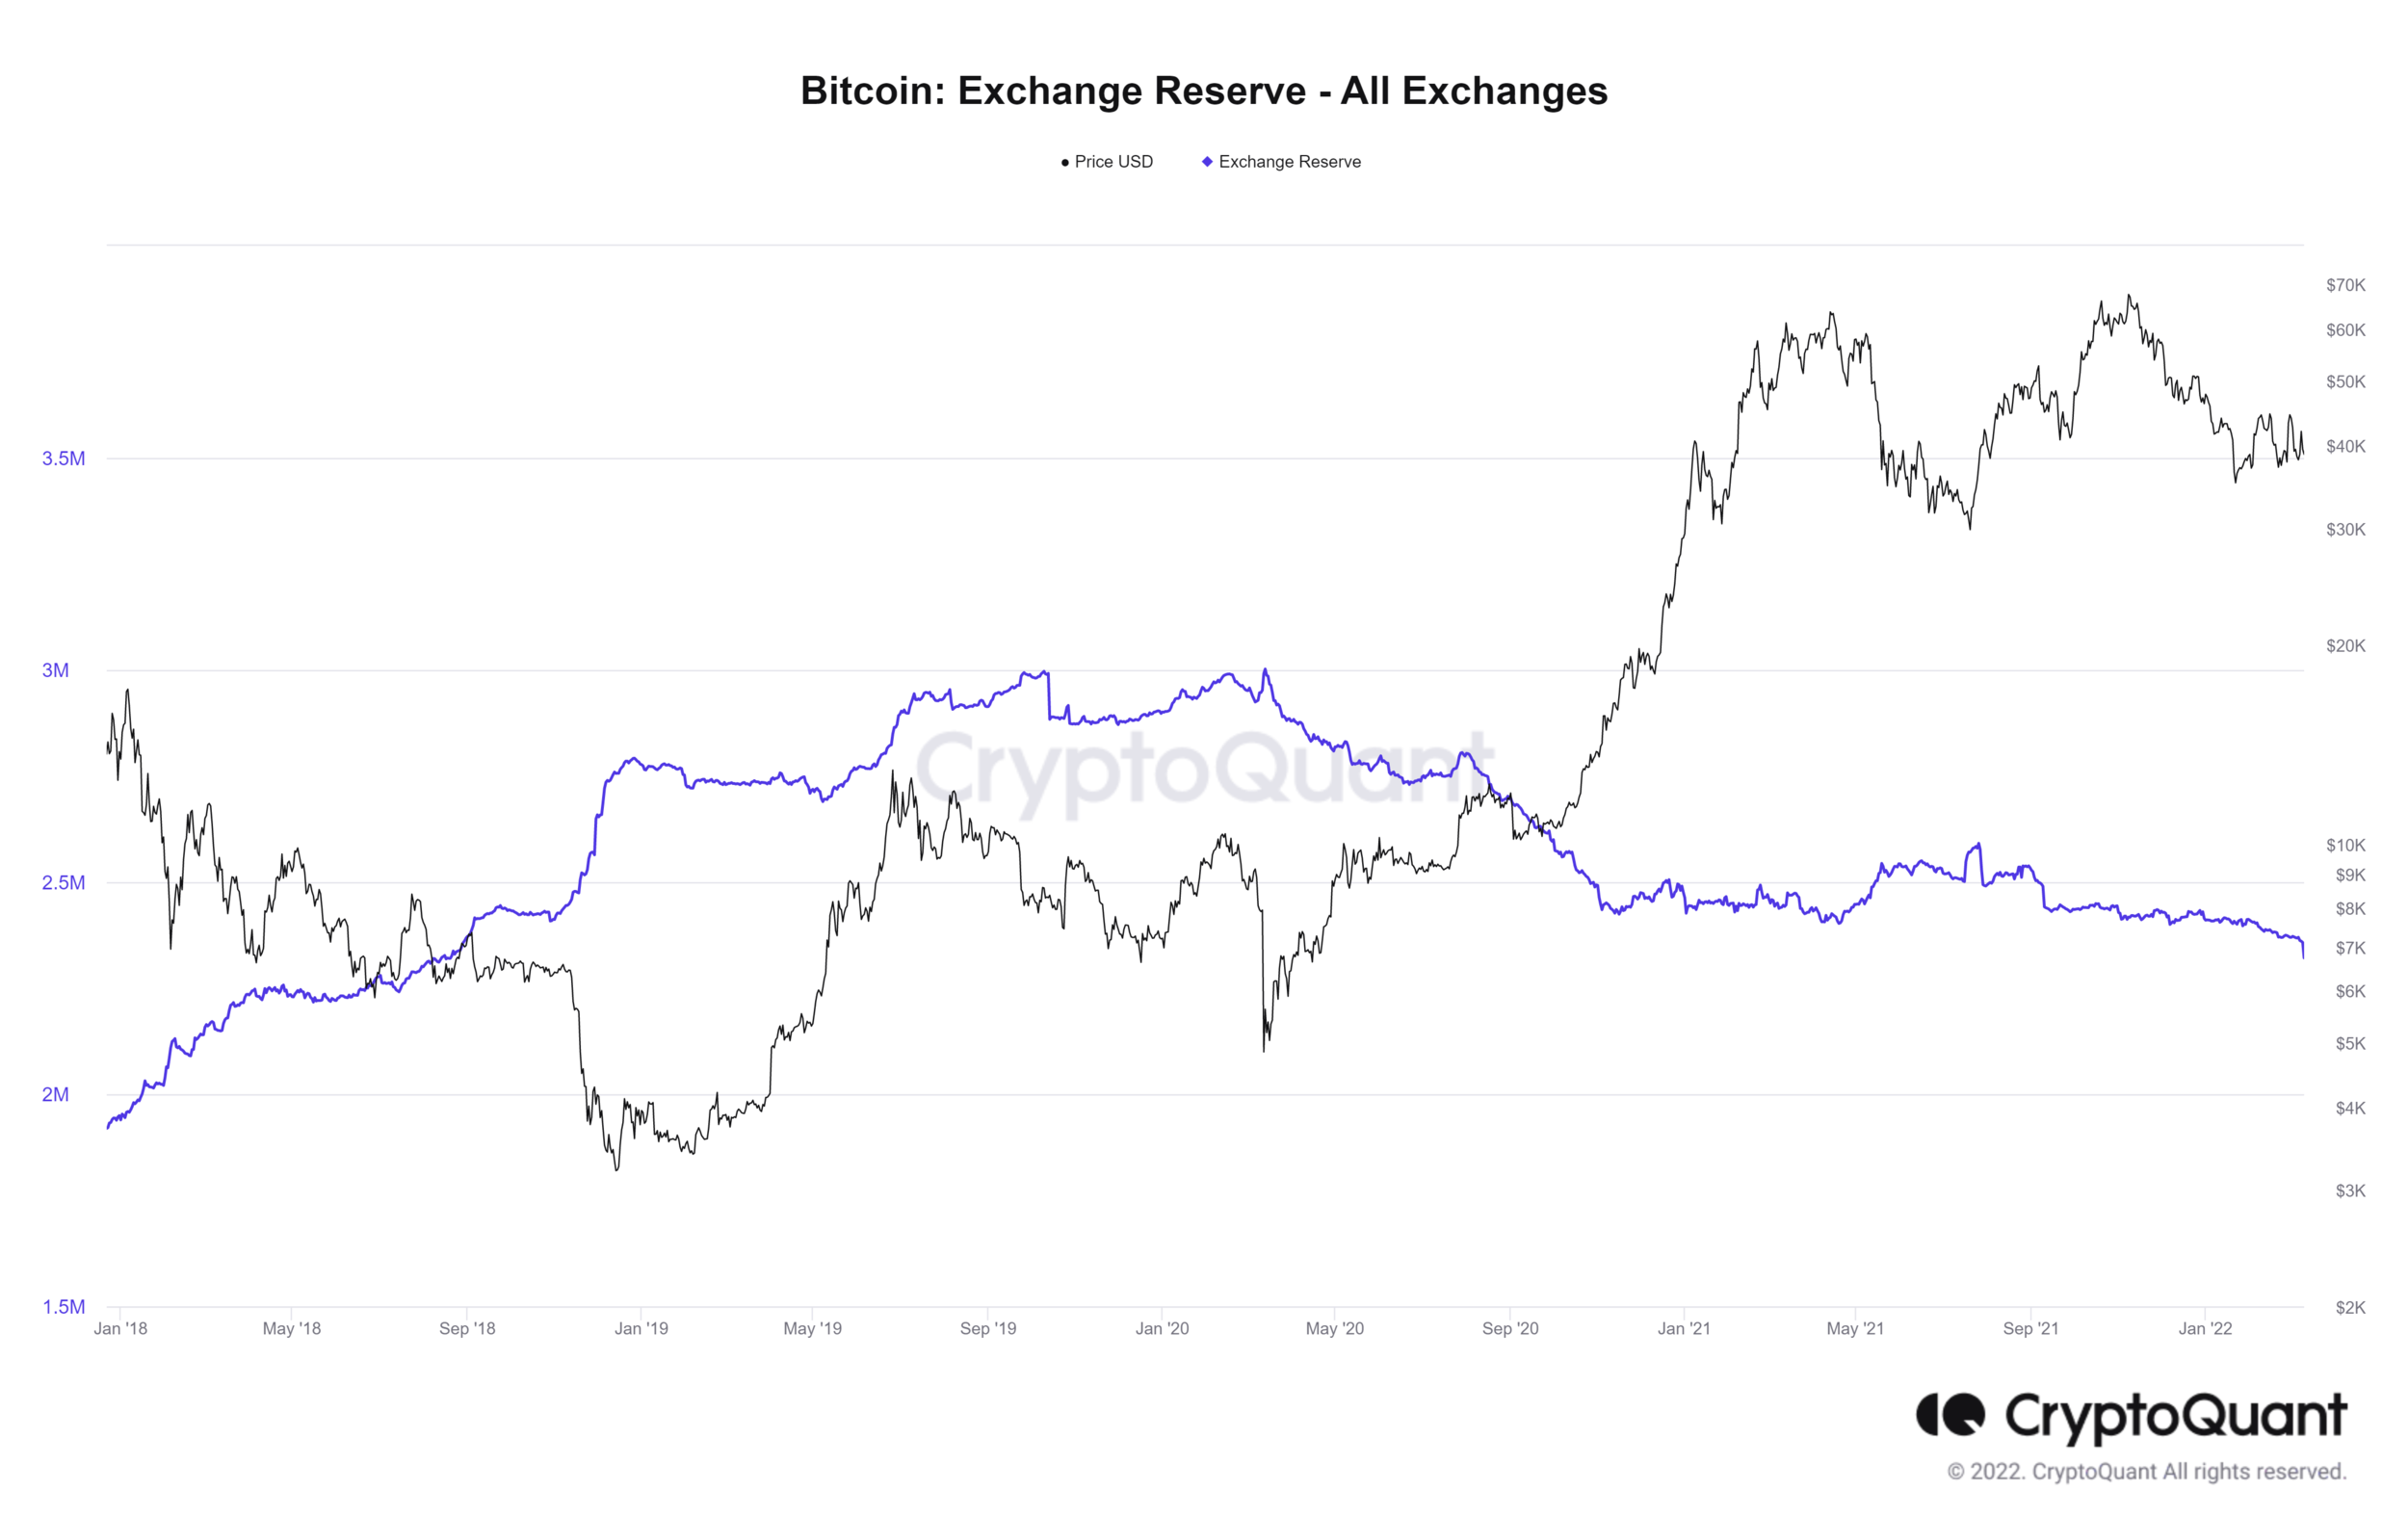
Long-term exchange movements continue to trend favourably, as there has been a clear continued increase in willingness for investors to hold BTC off-exchange (i.e. HODLing in cold storage).
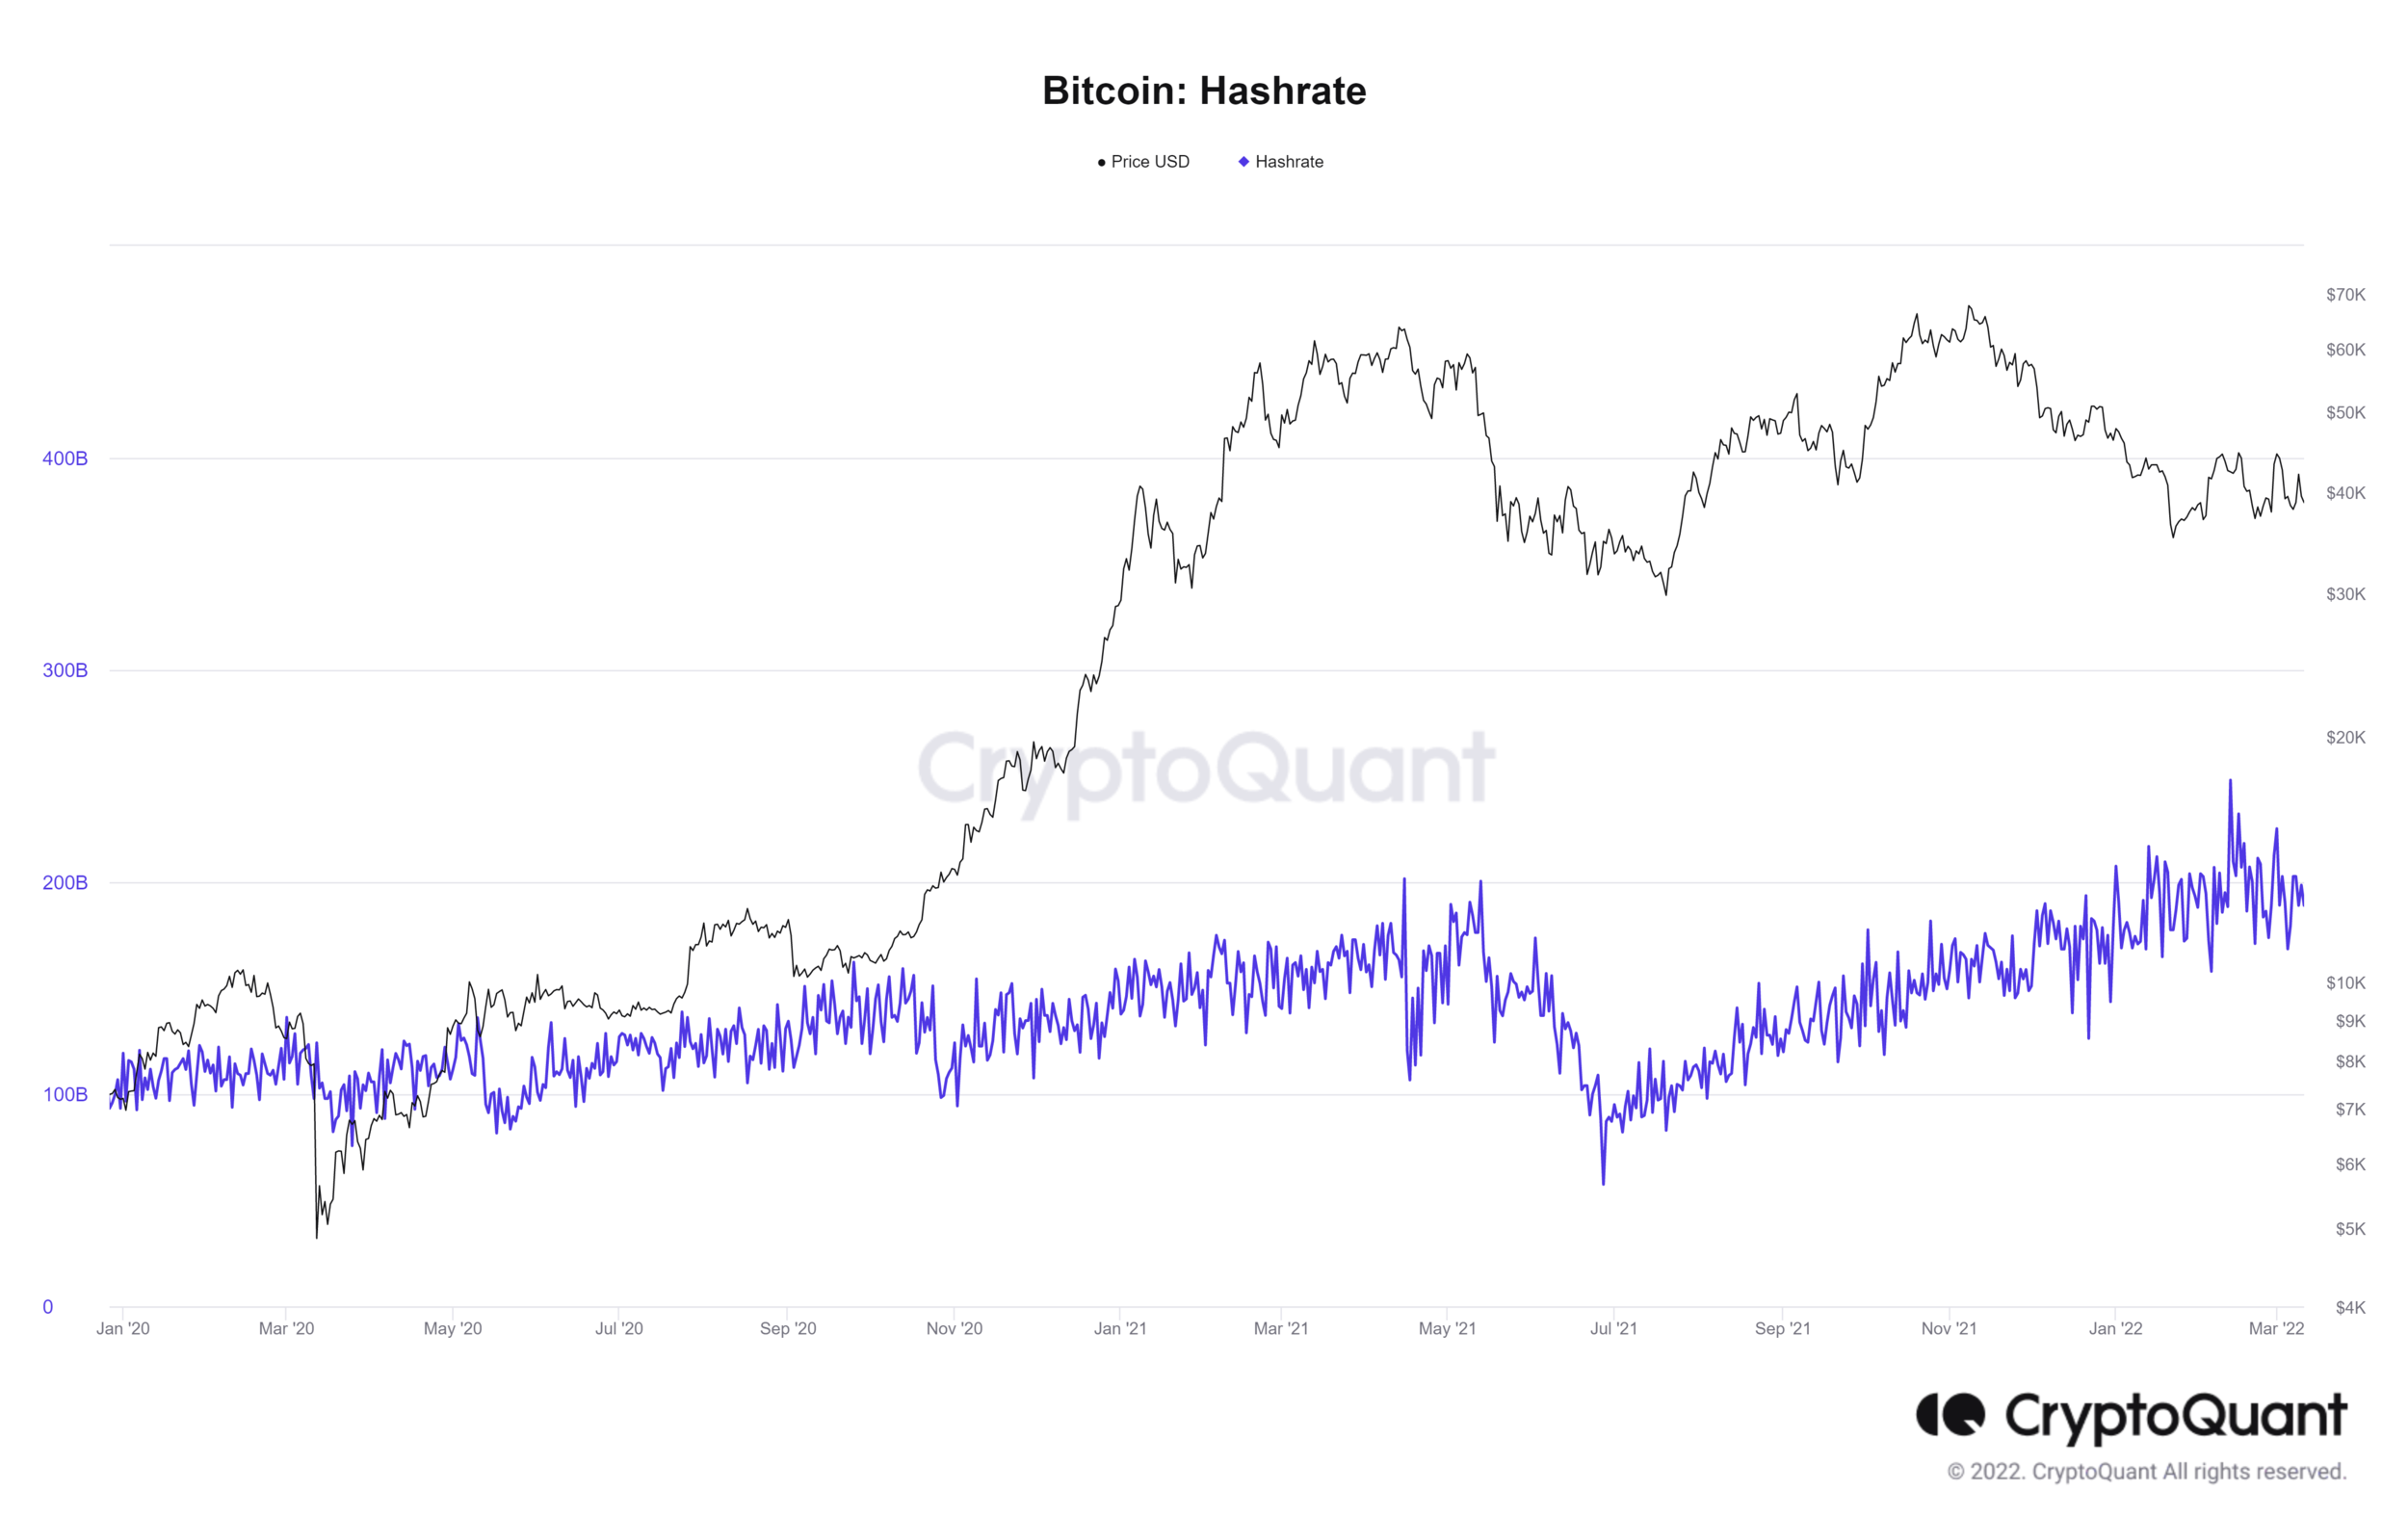
And finally, one other development I would like to point out that portends favorably for the crypto space as a whole is how the hash rate (which can be considered a proxy for the security of the Bitcoin network) has gone on to reach an all-time high, despite Bitcoin still being nearly 45% off the highs set back in November. This is certainly a healthy trend and one we didn’t necessarily witness during 2021.
As we can see, despite the short-term macro headwinds at present, we are beginning to see some constructive signs longer-term and are nearing levels whereby investors can slowly but surely begin dipping their toes in the market once more.
Summary and key takeaways
Volatility has once again dominated the crypto markets of late.
Given the unfavourable macro outlook, expect this to continue for the coming quarters, particularly so as crypto is trading in-line with high-beta stocks.
Technically, a break below $34k for BTC and $2,350 for ETH could usher in further declines. Such outcomes would provide excellent long-term buying opportunities.
We are slowly seeing positive long-term developments from various on-chain indicators, as Bitcoin is slowly but surely reaching the buy zone.