Why We Should Expect Higher Volatility For Longer
Summary & Key Takeaways
The credit cycle and the economic cycle are excellent leading indicators of volatility.
Both are likely to continue deteriorating in the months ahead.
As such, expect high stock market volatility to be a mainstay for 2023.
High Volatility Set To Continue
Equity volatility is primarily a function of slowing economic growth and deteriorating credit conditions. Unfortunately, despite 2022 being mired with bouts higher stock market volatility, economic volatility and fixed interest volatility, these trends are set to continue. Simply put, investors should brace for a prolonged period of higher volatility. Investing in risky assets during such times is not pleasant.
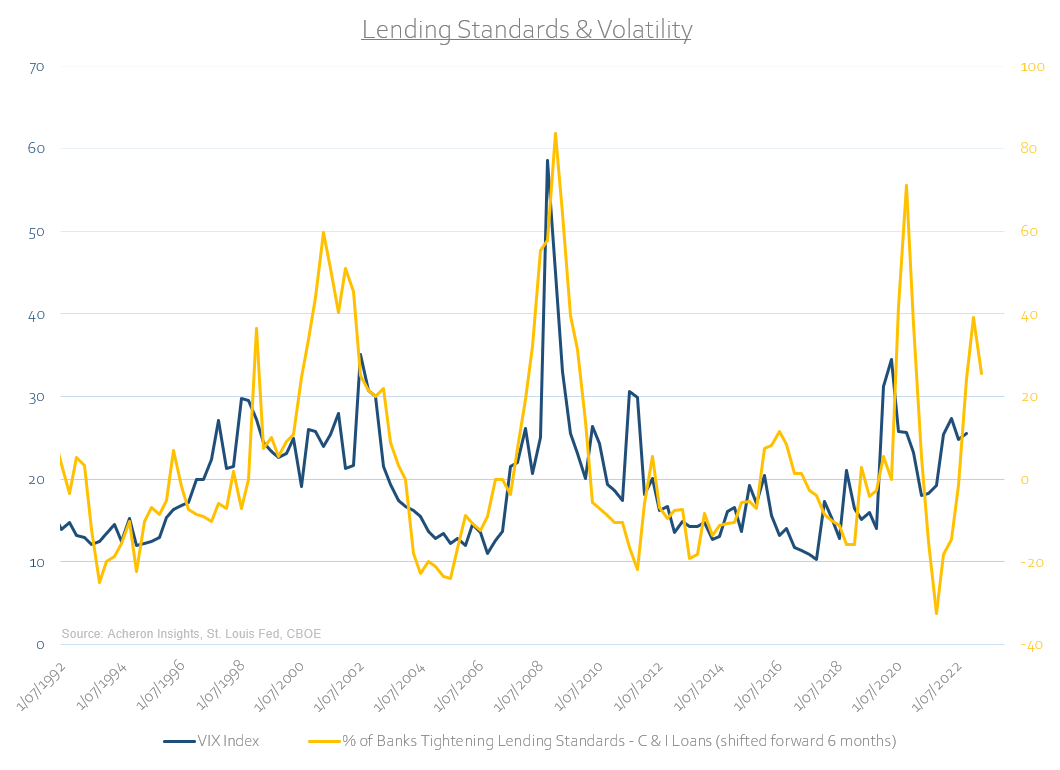
The Credit Cycle Drives Volatility
The credit cycle is perhaps the best leading indicator of volatility. We live in a world where access to credit is vital not only for corporations to thrive, but to also survive. Higher credit spreads generally correspond with higher equity volatility.

Debt can paper over all wounds, especially when it is cheap and abundant. When credit conditions are loose and corporations can easily borrow, credit spreads are low as the risk of default reduces. This usually corresponds to periods of accelerating economic growth and abundant liquidity as corporations are overly optimistic and risk-seeking. However, as the business and liquidity cycles decelerate, credit is not so freely available for corporations as banks are less willing to lend. For corporations who have overextended themselves with debt financed unprofitable ventures, this is particular troublesome.
An excellent predictor of this dynamic is the shape of the yield curve. As the curve inverts, bank margins are squeezed and their incentives to lend monies to riskier counterparties are reduced. As such, the percentage of banks who are tightening lending standards tends to increase. If you are a bank, your preference is to borrow short and lend long, profiting from the spread. This spread evaporates when the yield curve inverts.

As lending standards for commercial and industrial loans to corporations tighten, we generally see a subsequent fall in the growth of such loans over the following year.

A reduction in the availability of credit thus results in the widening of credit spreads. This puts significant stress on overleveraged companies who are unable to access credit when they need it most. This lack of access to credit strains cash flows and balance sheets, leading to financial stress and even defaults, which in turn further reduces access to credit as credit spreads widen further, exacerbating the trend.

As spreads widen, volatility ensues. Ultimately, such financial stress and uncertainty finds its way into higher implied volatility and higher realised volatility. Without a liquidity backstop from the central banks, the stock price is the release valve. Unfortunately, the Fed have made it very clear the ‘Fed Put’ will be struck materially lower than in recent years. Inflation and labour market tightness have changed the game.
We should therefore expect credit spreads to continue to widen over the next year or so. This is particularly true in an environment where institutional money no longer needs to take excessive risk to achieve their benchmark returns when risk-free rates are offering 3-4%. The unwinding of the TINA trade does not bode well for high-yield credit, which means it does not bode well for stocks, which does not bode well for volatility.

The Business Cycle Drives The Credit Cycle
The overlap between the credit cycle and business cycle is clear. The outlook for the latter will only exacerbate the former, all the while likely leading to a prolonged period of higher volatility.
Macro matters now more than it has in a long time. The business cycle is at the center of nearly every asset class, and volatility is no exception.

As I have heeded for some time now, the leading indicators of the growth cycle continue to suggest deceleration. A recession may or may not be the outcome, but either way, we should expect to see the growth cycle to continue to head lower in the coming months.
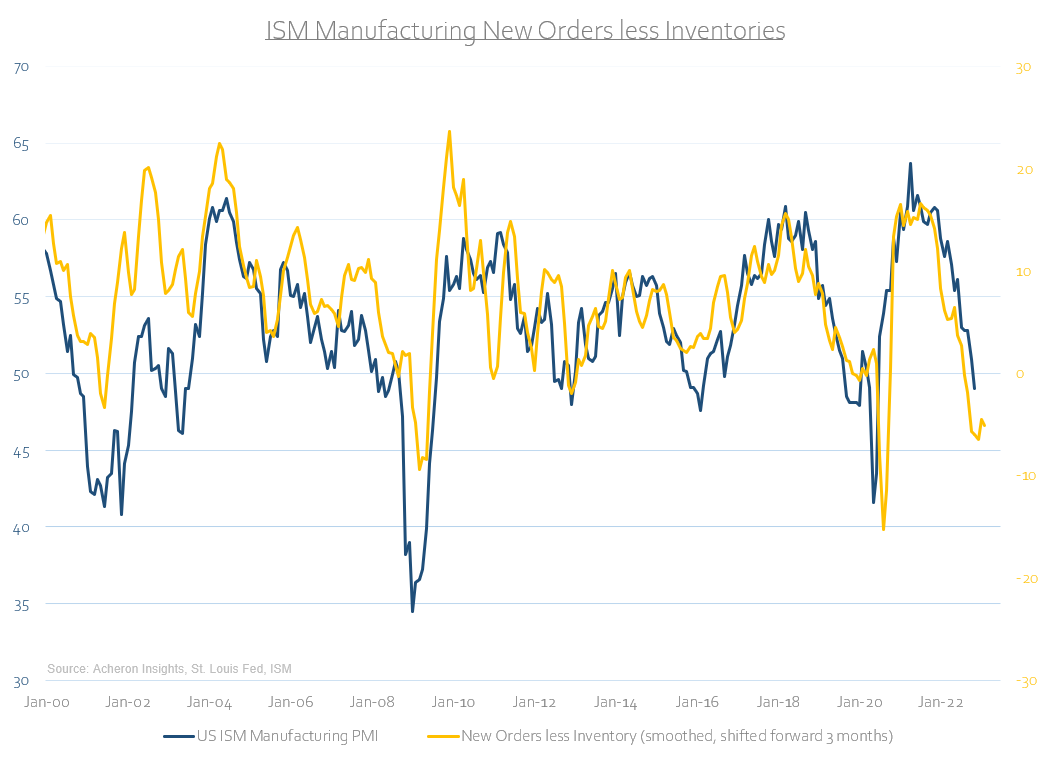

Indeed, so long as central banks worldwide continue to tighten monetary policy on net, growth will suffer.

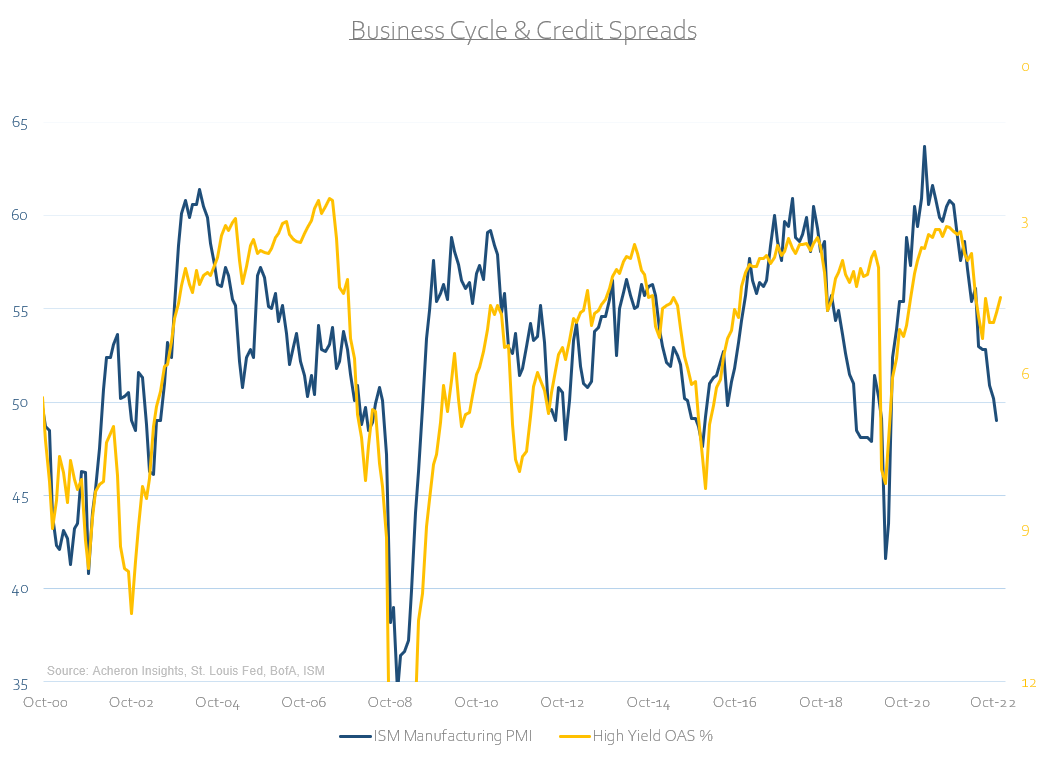
And as growth declines, so do volatility and credit spreads rise. If we look at where credit spreads are priced versus the business cycle, one could easily infer that spreads are yet to reflect economic reality. Should credit spreads re-price higher, volatility will likely follow suit. While this does not necessarily mean stocks have to go lower in 2023, it does suggest next year will be just as volatile as 2022.
The Short-Term Outlook For Volatility
An important consideration when assessing the leading indicators of volatility described above is the variability of their lags. The economic and credit cycles are generally slow moving and bear little influence to the immediate market action.
On a shorter-term time frame, there are a number of market conditions which generally lead to higher realised volatility. One such measure is the S&P 500 relative to its primary moving averages. As we can see below, when the index is below its 200-day moving average (which generally coincides with a down-trending market), volatility tends to be materially higher compared to when it is above this moving average. Following last week’s post FOMC sell-off, we are once again below both the 200 and 100-day moving averages.

Another useful tool that presages periods of higher or lower volatility is the relative performance of lumber versus gold. Per the work of Michael Gayed, when we have prolonged periods of lumber outperformance, we generally see average annual volatility at a lower level than when we have periods of lumber underperformance. The general idea here being that an accelerating lumber to gold ratio is indicative of strong economic growth and thus corresponds with more favourable market conditions.


And finally, what is likely the very best indicator of realised volatility in the immediate future is the approximate level of dealer gamma exposure. You can enjoy a primer on gamma and how this dynamic sees the tail wag the stock market dog here, but, the basic crux of gamma exposure held by dealers is when they are short gamma, they trade with the market, thus exacerbating volatility. Conversely, when they are long gamma, they trade against the market, dampening realised volatility. Per the work of Tier1 Alpha below, we can see the standard estimates of dealer gamma positioning sees us currently well and truly in negative gamma territory, as is commonplace during market declines. As such, we should be in for a volatile Christmas.

Source: Tier1 Alpha

With the short and medium-term outlook for volatility suggesting we have a bumpy ride ahead of us, coupled with still decelerating growth and liquidity cycles and a so-so outlook for stocks in general, being long risky assets which lack fundamental support may not be the panacea going forward that it has been in recent times. Investors should adjust their expectations accordingly.
. . .
Thanks for reading!
If you enjoyed this article, feel free to share this with friends and around your network. Any and all exposure goes a long way and is very much appreciated. Thanks again.