Growth Cycle Outlook: 2022 Will Not be 2021
Not much has changed in regards to my economic growth outlook going forward since my most recent growth cycle update. We continue to be on the precipice of a material decelerate in growth due to hit markets in the coming months as predicated by the leading indicators of the growth cycle. For now, growth did indeed rebound to some extent in Q4 of as many predicted it would.
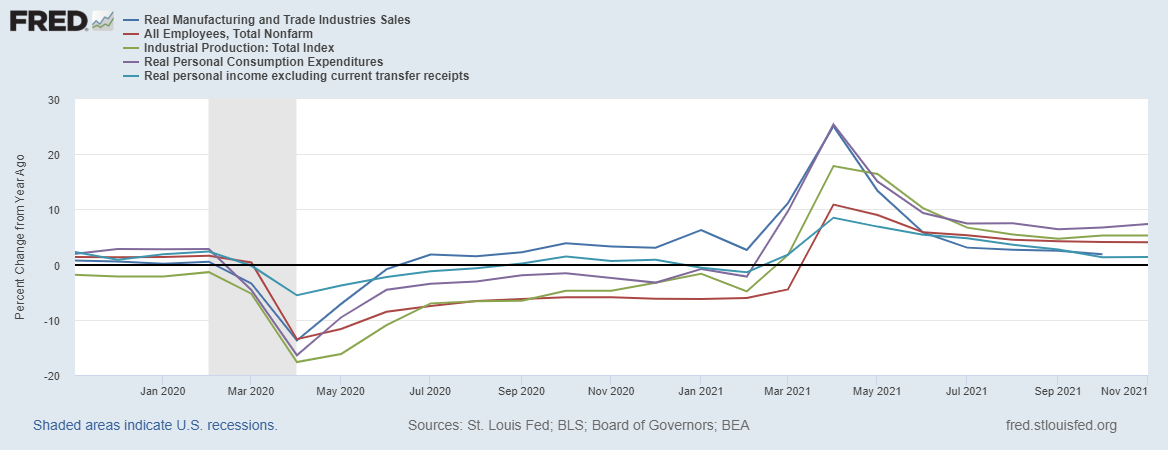
The following chart highlights various coincident growth metrics, which give us an up-to-date view of where we are generally in the growth cycle and where we have been. These coincident metrics include real manufacturing and trade sales, non-farm employment, industrial production, real personal consumption and real incomes excluding-stimulus payments. On the whole these metrics give us a broad view of coincident economic growth and as we can see below, growth peaked around April 2021 which coincided with the peak of the reflation trade.
Indeed, if we look at the market performance of some of the most pro-cyclical stock market sectors as a means to assess the reflation trade, we can see their relative performance compared to the S&P 500 peaked in and around Q2 2021. We did again see relative outperformance in late Q3 as these areas of the market began to price in the Q4 growth bounce, though this was short-lived relative to the reflation trade that look place from late 2020 and into 2021.

Over recent months, we have seen a clear shift towards the defensive areas of the market, with utilities, health care, REITs and consumer staples all outperforming the broad market of late and seeing constructive technical action to the upside.
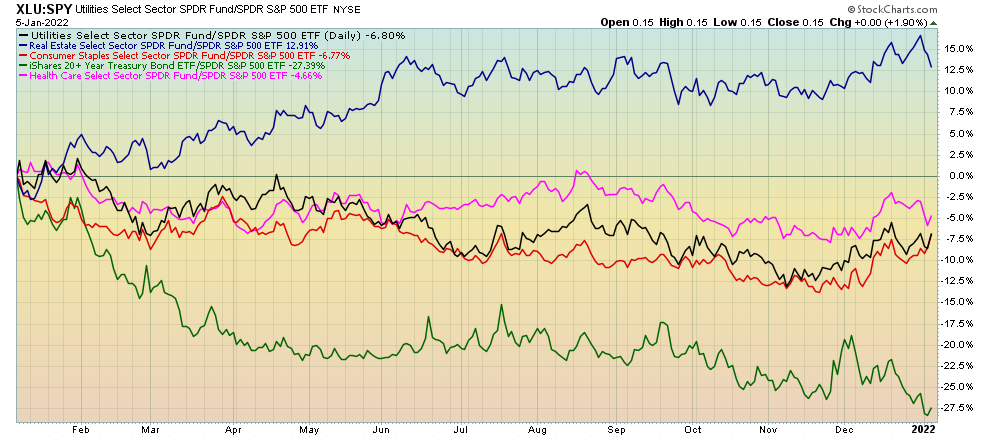
It is worth noting however these defensive sectors have by-and-large become overbought relative to their cyclical counterparts, and as such has preceded a clear shift back to pro-cyclical and high-beta risk assets for the time being.
Turning now to the forward outlook for the growth cycle, the long leads have been telling us for some time growth is likely to inflect lower in 2022. The Chinese credit impulse leads the growth cycle by around twelve months, given China’s role as one of the primary drivers of world growth. The credit impulse metric measures the rate of change of newly created credit via commercial bank lending and government stimulus. This peaked in early 2021.
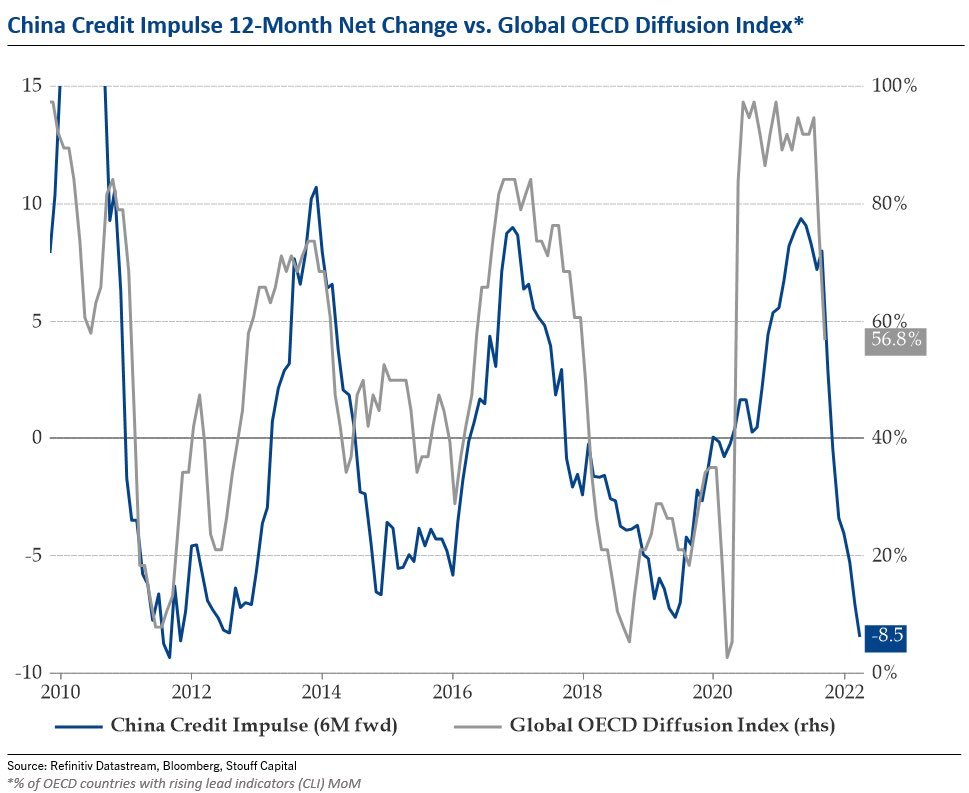
Source: Julien Bittel - Stouff Capital
Likewise, liquidity measures continue to deteriorate. A continued slowdown in overall liquidity over the coming months is likely to begin to realise itself in asset prices, particularly so when the tapering of asset purchases by the Fed accelerates. The following chart is CrossBorder Capital’s measure of global liquidity and its implication for global wealth, to which it has historically been a solid long-term leading indicator. Liquidity is one of the primary drivers of asset markets and a deceleration in liquidity is cause for some concern.
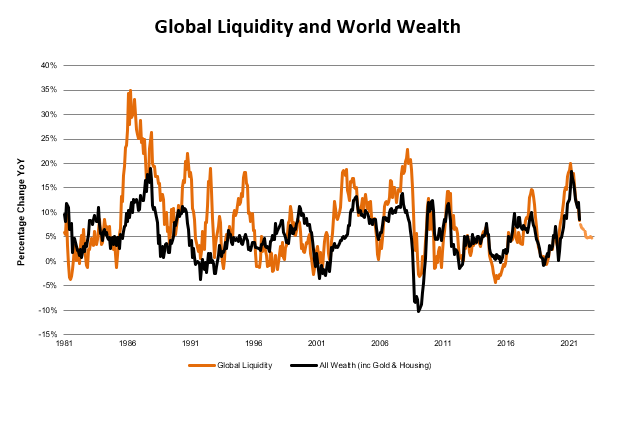
Source: CrossBoarder Capital
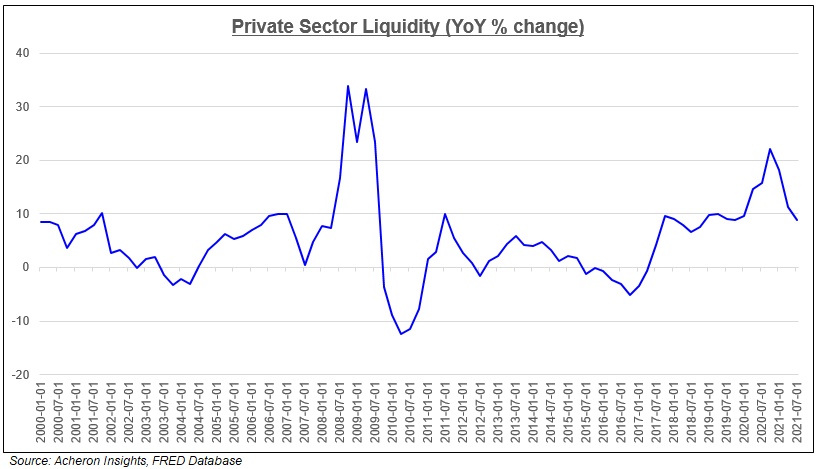
If we focus on the areas of liquidity most likely to impact the private sector and thus the real economy, the message is not much different. The following chart is the aggregate measure of the year-on-year rate of growth of the physical currency in circulation, household checkable deposits and currency, small time deposits, large time deposits and money market funds total assets.
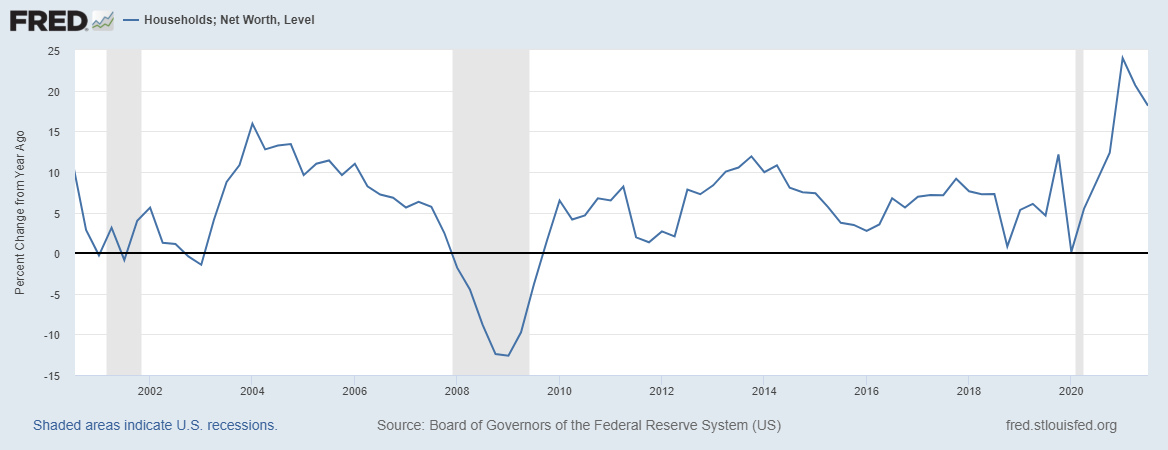
Paying closer attention to household sector, the growth rate of household net worth has historically been another excellent long lead for the growth cycle and leads consumption by around six months. Household net worth peaked in Q1 2021 and has since inflected lower.
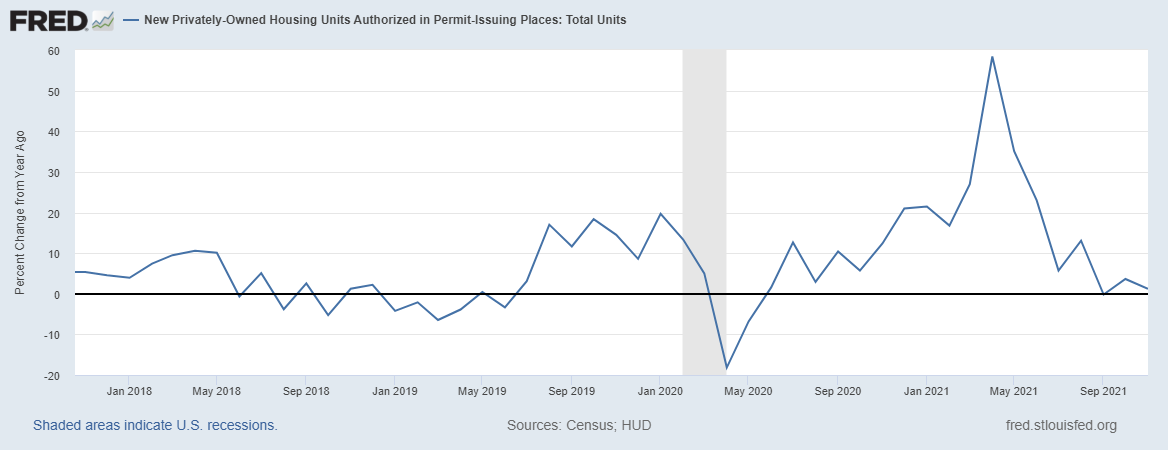
Likewise, building permits continue to decelerate lower. A reduction in building permits is indicative of slowing growth in housing and construction as building permits precede the construction of new housing and indicate lessening demand, as well as being impacted by various cyclical factors such as disposable income and interest rates. Given housing’s importance to the economy, building permits do a solid job forecasting the housing market and provide a long-lead for the growth cycle.
From a consumer perspective, inflation continues to impact demand. The University of Michigan Consumer Buying Intentions Survey for vehicles, houses and household goods all continue to trend lower. Given how real incomes have been decelerating on a rate-of-change basis in the past year, this shouldn’t be a huge surprise.
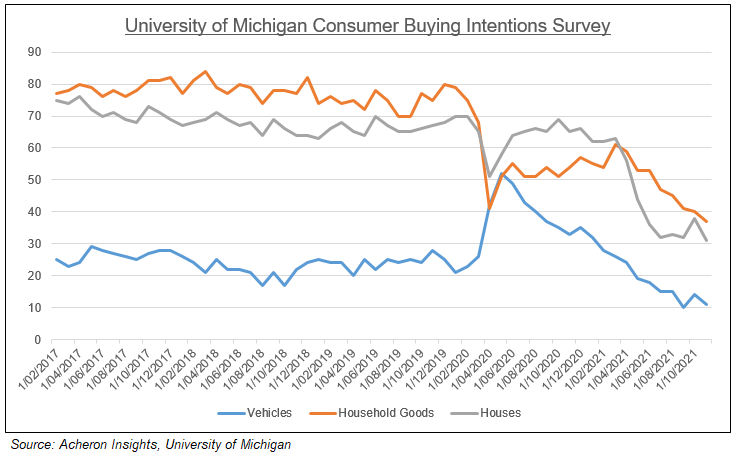
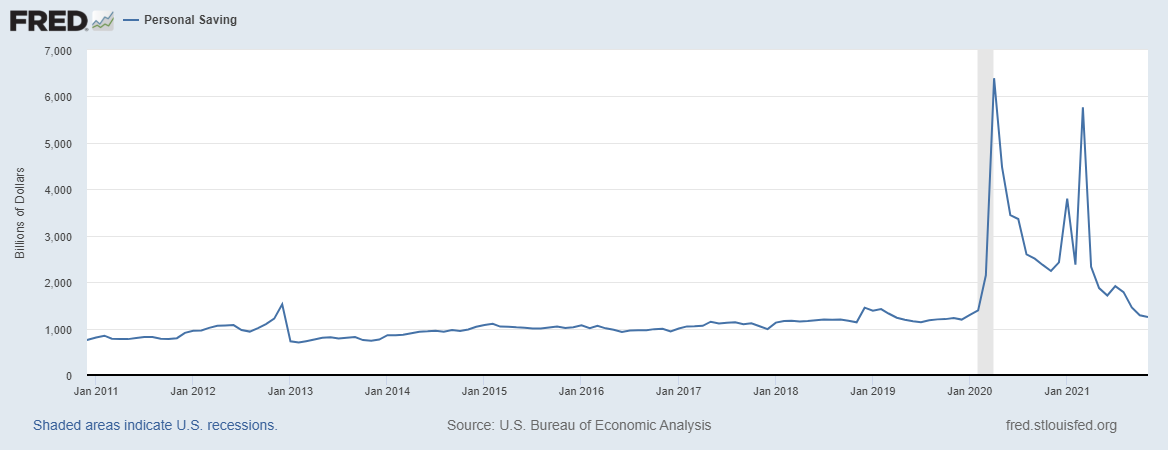
When real income is falling, that is, costs increase by more than incomes, consumption must then be maintained via new debt or drawing down from savings and investments. Unfortunately for consumers however is that savings have fallen back to trend and thus is indicative of falling future growth potential.
As such, it is not surprising to see many of the shorter leads of the growth cycle starting to turn back downward after a brief respite of late. The Economic Cycle Research Institute (ECRI) Weekly Leading Index has once again turned lower. This metric peaked in early 2021.
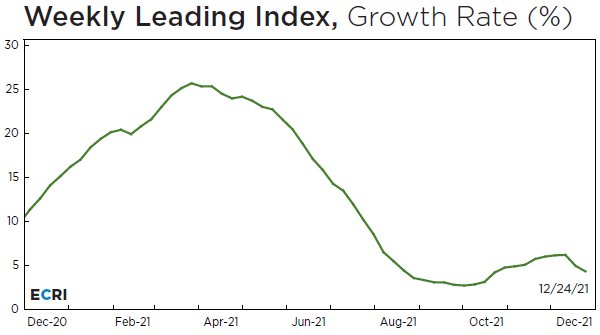
Source: Economic Cycle Research Institute (ERCI)
In addition to ECRI’s Weekly Leading Index above, of the several leading econometric forecasting models of economic growth which I monitor, almost all are decelerating.
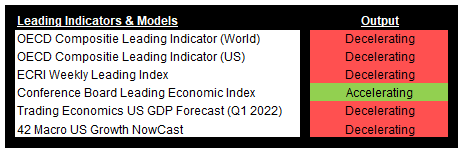
Sources: OECD, ECRI, Conference Board, Trading Economics, 42Macro
Digging further into the shorter leads within the manufacturing sector, several of the sub-components of the US ISM Survey help provide key insights into the direction of the manufacturing sector. We can see below the New Orders Index registered its second lowest reading in nearly 18 months. New orders provides a timely insight into the direction of demand. Likewise, we can see that pricing pressures are beginning to ease across the manufacturing sector. Likewise, the Backlog of Orders index within the ISM Survey also continues to move downward, perhaps indicative of easing supply chain pressures. Such measures seem to indicate inflation will at some point in the near future begin to trend lower in rate-of-change terms. Though inflation will likely remain at much higher levels on a nominal basis, what matters primarily for asset prices is the direction of change in growth and inflation.
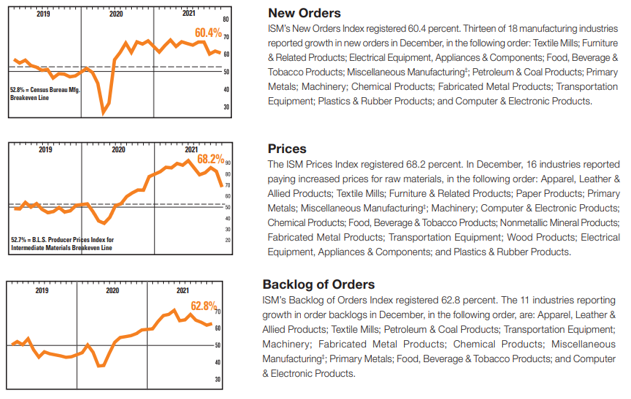
Source: Institute of Supply Management
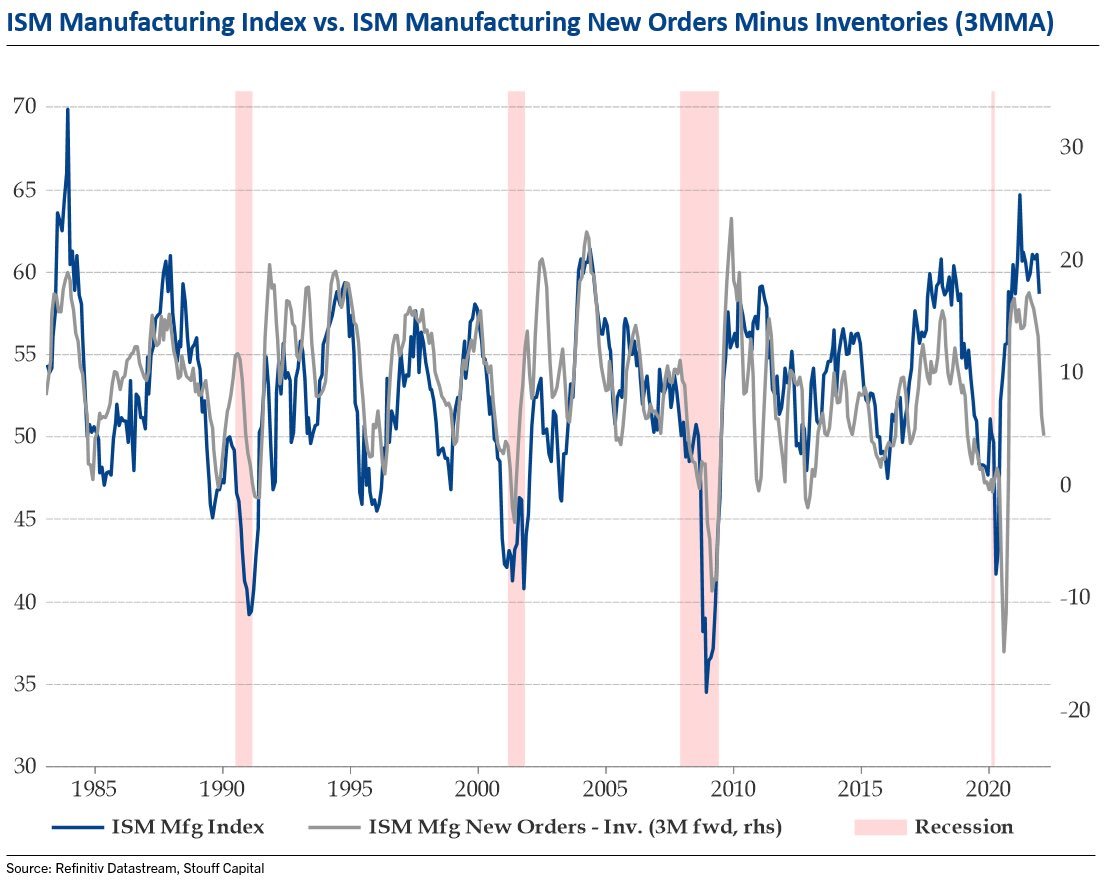
If we examine the spread between the ISM Manufacturing New Orders Index above and the ISM Inventories Index, have have historically been able to track the direction of the overall ISM Manufacturing Index itself by about three months. We can see this below courtesy of the great work by Stouff Capital’s Julien Bitel. As the new orders to inventory spread falls, this means inventories are increasing faster than sales, and less inventory then needs to be produced going forward. Less production means less workers and thus is indicative of falling demand.
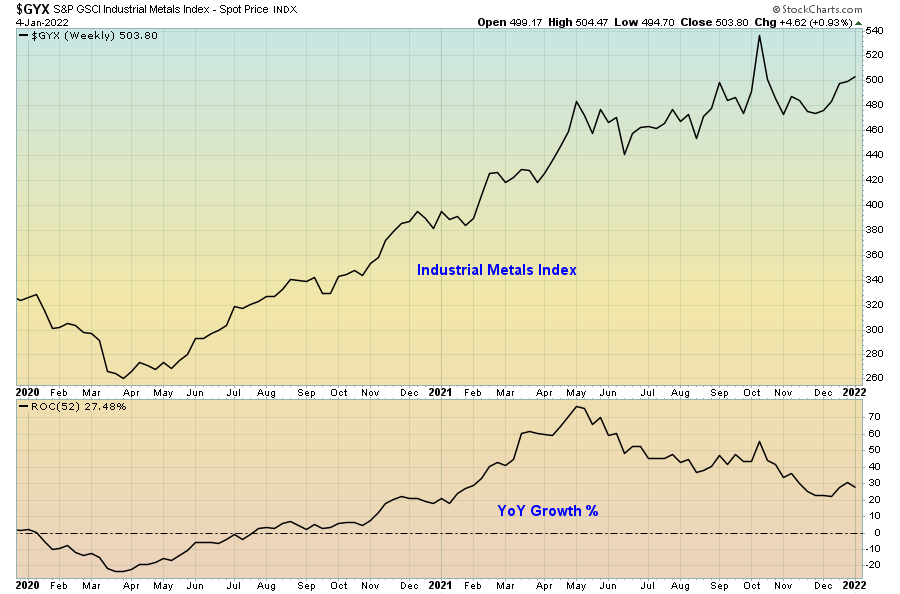
The growth in industrial commodities is confirming this message. Industrial commodities and metals such as aluminium, copper, nickel, zinc and lead are more likely to follow the growth cycle as increases or decreases in industrial production and manufacturing require the use of these commodities. To confirm the next move higher in the growth cycle we would ideally like to see a move higher in these type of industrial commodities.
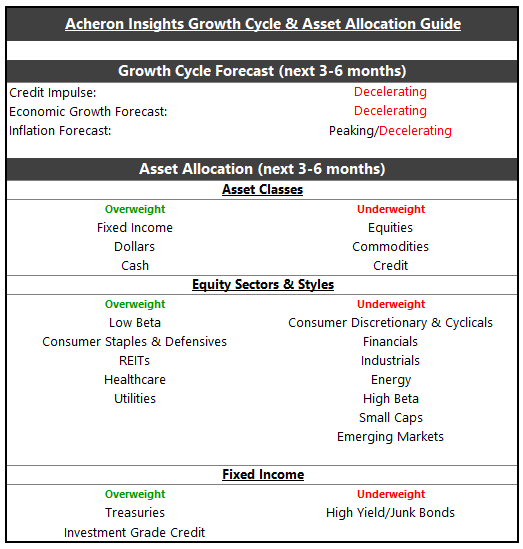
As we can see using the short and long leads of the growth cycle, it is relatively clear that a deceleration in growth and inflation is the highest probability outcome for 2022. What this means from an asset allocation perspective is relatively straight forward; investors will do well to underweight their pro-cyclical exposure and overweight their defensive exposures. An overweighting of defensive exposures allows investors to allocate to the asset classes and equity style factors which have historically done best during times of decelerating growth. The following chart provides an asset allocation guide given my current growth cycle outlook over the next six months or so.
However, I say that to say this; a macro framework and outlook is only once piece of the puzzle. One’s macro outlook should not necessarily be cause to overlook a micro opportunity. I use my macro outlook to assist with my risk management and tactical exposures to my various holdings. Additionally, we cannot forget that macro is inherently slow moving by natures, so it becomes important to understand timeframes when one has a bearish macro view, as some of the biggest moves in markets occur during the late stages of the growth cycle.
It may well be the case that we do see a high-beta driven risk-on rally eventuate over the coming weeks and into the latter stages of Q1 2022 before the Fed accelerates its tapering. Likewise, we have largely seen the defensive equity sectors become somewhat overbought of late, and as such it appears some of the pro-cyclical areas of the market could well lead the market higher.
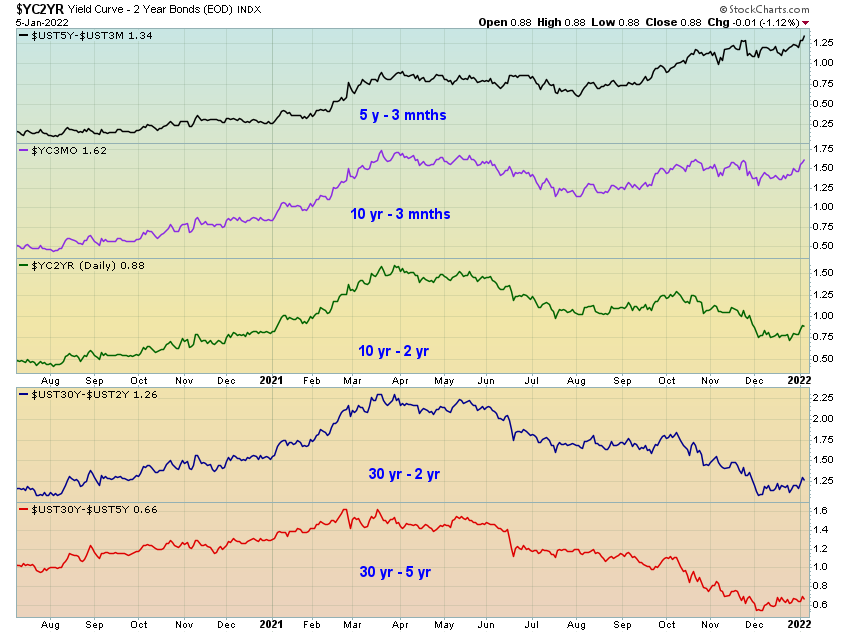
Indeed, we can see this by examining the various iterations of the yield curve. Whilst the longer yield spreads such as the 10s/2s, 30s/2s and 30s/5s remain in a downtrend overall as the bond market continues to price in slowing growth, we are seeing a minor steepening of late which would do well to favour pro-cyclical assets should this continue.
Should the 10-year treasury yield break out of this range and hit 1.8%+, that would confirm this thesis and could be bullish short-term for pro-cyclical equities relative to their defensive counterparts, with small-caps and financials being two such beneficiaries.
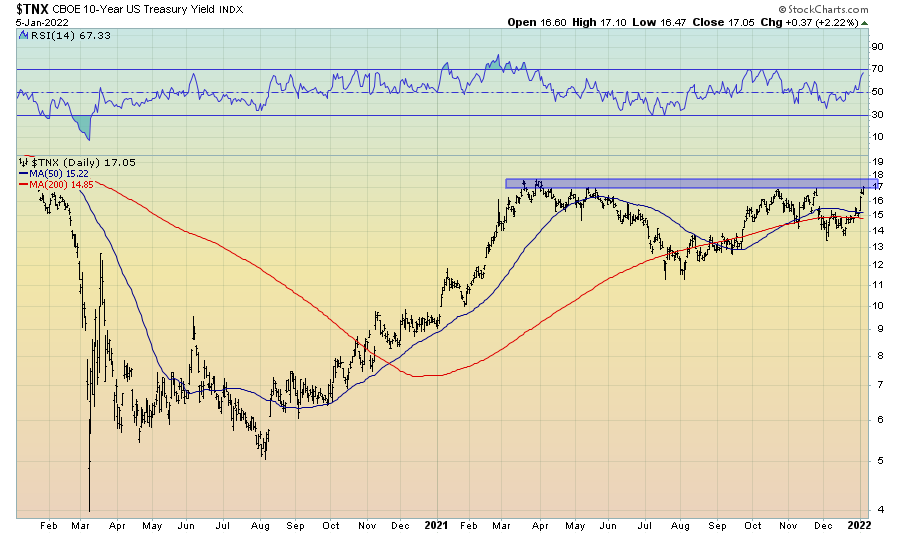
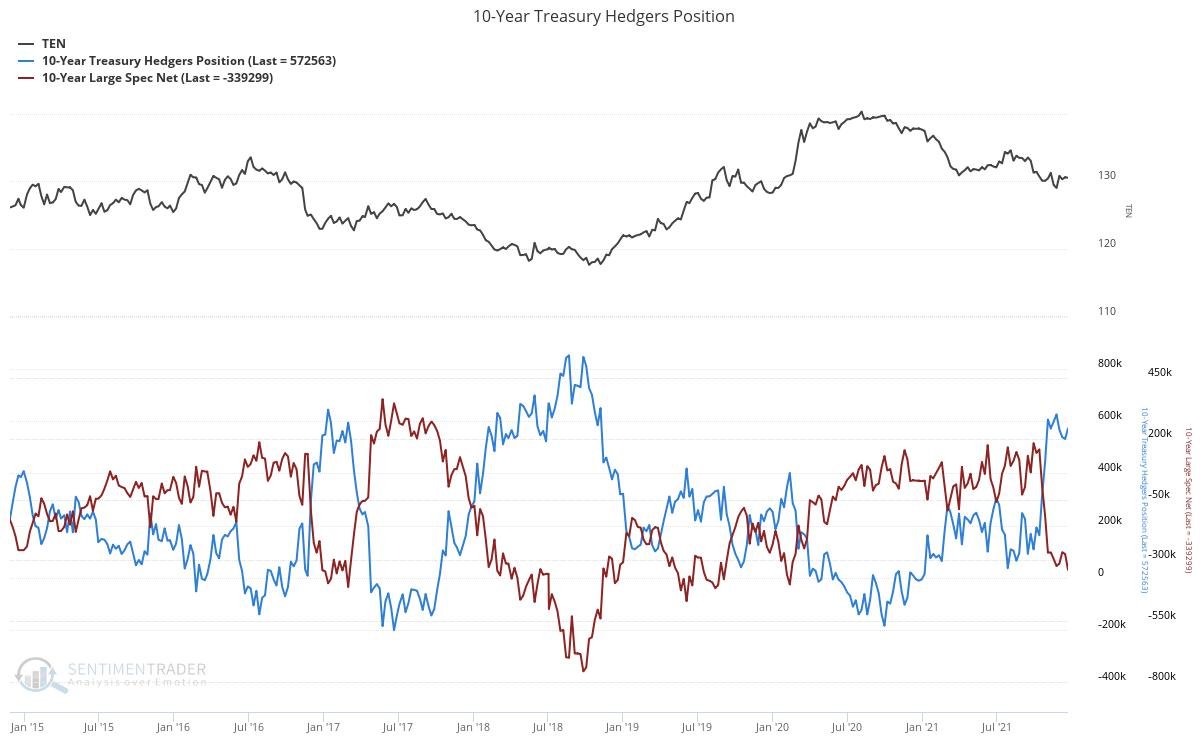
If we do see yields break higher I suspect a material move higher to be difficult given how commercial hedgers (i.e. the smart money) have on their longest 10-year treasury positions in the futures market in a number of years, whilst conversely, commercial hedgers (i.e. the dumb money) are heavily short 10-year treasuries. Should this level therefore reject, we would likely see any pro-cyclical rotation be short-lived.
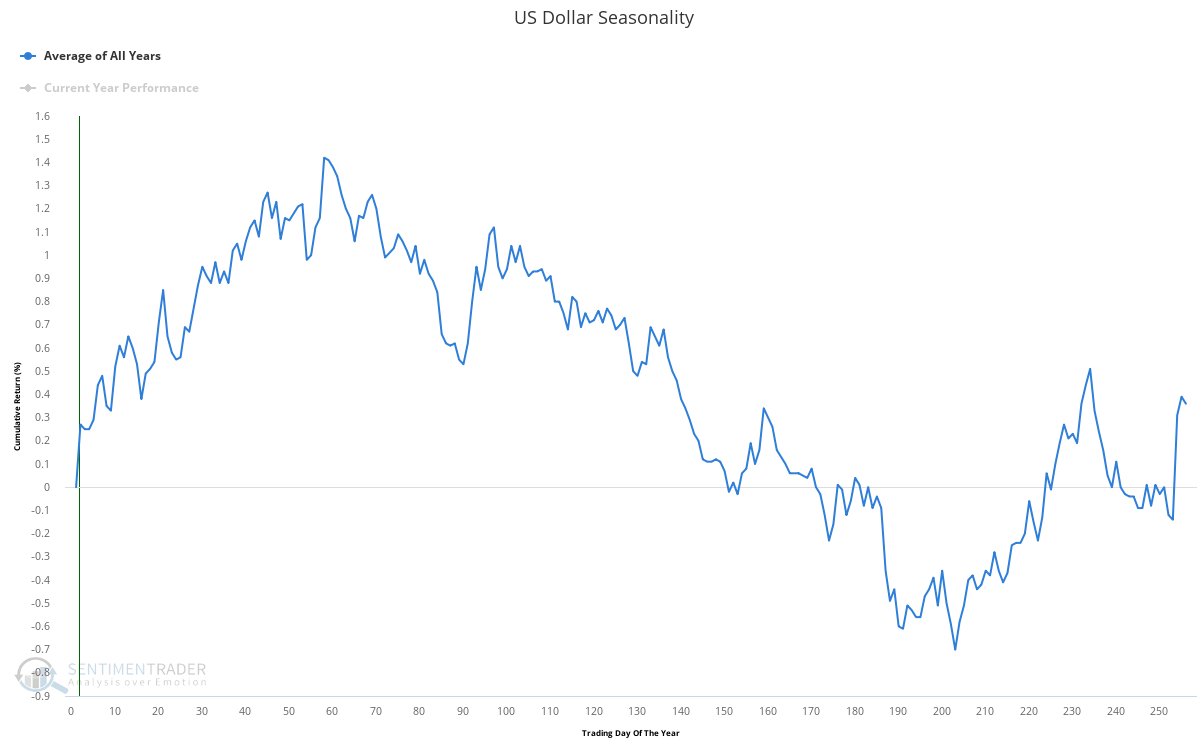
What’s more, the dollar wrecking ball is entering its most seasonally bullish month of the year in January.
The dollar has consolidated nicely following its recent move higher and is looking like it wants to bounce off the 50-day moving average. This could well be the impetus for its next move higher.
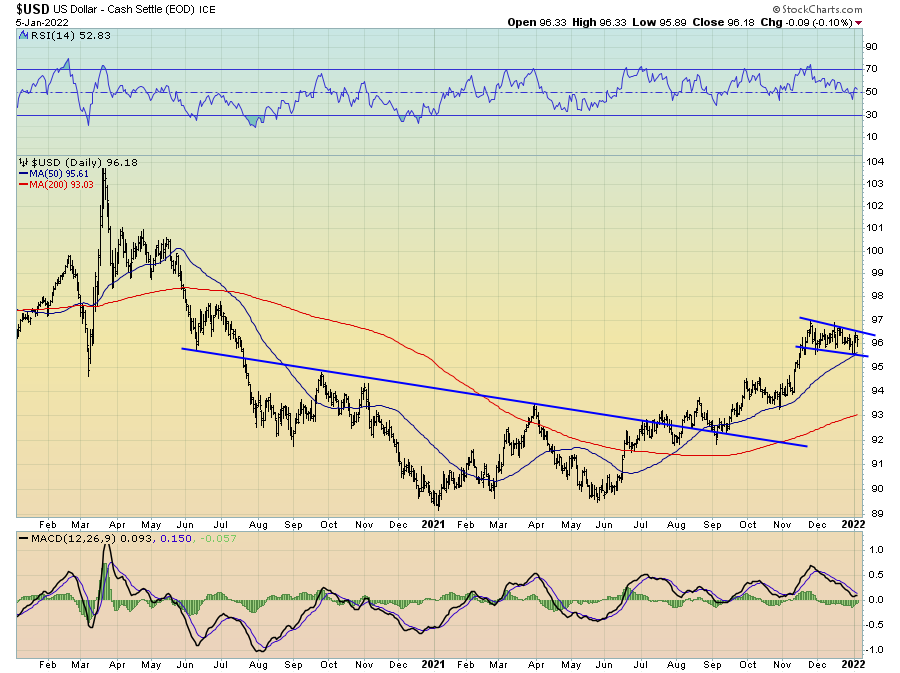
As I have mentioned in the past, Lacy Hunt refers to the currency markets as the most forward-looking of all markets, and a higher dollar indicative of a weakening economy.
Summary
In summary, the growth and liquidity impulse that drove the reflation trade throughout the past couple of years is now over, meaning the easy money has been made. As growth and inflation look to decelerate further in the coming quarters, investors will do well to continue to transition their portfolios to a more defensive nature.
With the nominal value of inflation higher than anything the market has experienced in recent times and likely to remain so (though on a decelerating basis), the dynamic of how the Fed will intervene within markets via the “Fed Put” may no longer be as supportive of asset prices going forward as it has been in the recent past. Whilst the Fed has implicitly supported asset markets up until now, their mandate is to maximise employment and achieve stable prices. Though it may be difficult to believe, the economy is their primary concern, it just so happens that due to the disinflationary trends holding down inflation up until now, this has allowed the Fed to remain easy and thus use the stock market as their conduit to supporting the economy. What is different in 2022 and beyond is the stock market and the economy no longer lay on the same path from the perspective of the Fed. Jerome Powell will now need to decide between combating inflation and stabilising prices into an economic slowdown (bad for stocks), or support the stock market which is likely going to struggle as the economy slows and the Fed tightens.
The “Fed Put” is likely to be much lower going forward than it has been in the past so long as the Fed now opts to help main street over wall street.