Chart Book: The Pain Trade Is Stocks Higher Into Year End
In this week’s edition of the Acheron Insights chart book:
The window of weakness is closing. Welcome to the window of strength.
The pain trade into year end is likely higher.
Along with the structural flows around seasonality, investor positioning and sentiment should provide some reprieve for stocks as well as bonds as we close out 2023.
One: Welcome to the window of strength
Yes, seasonality does matter. In my last Chart Book I discussed the importance of the options expiration cycle and its role in how the market behaves throughout different stages of the year. September and October are generally poor months as they are periods whereby structural flows based around volatility and dealer hedging are at their weakest, while conversely, during November and December they are at their strongest.
As a refresh, the factors which help drive this dynamic and have been doing so throughout 2023 are:
There remains a decent supply of skew and volatility, meaning bullish Vanna and Charm flows will be powerful during the final months of the year.
These flows should enter the market during the November to December period during which there is the highest number of public holidays for the year, meaning there is less time in which markets are open (roughly 65% of the volume-weighted time compared to other months). Thus, more of the equity flows have the potential to be dominated by positive Vanna and Charm flows.
Performance chasing by hedge fund and equity managers who have lagged the index all year, and see this correction as a buying opportunity to pick up some alpha as we close out the year.
Target date funds/401k inflows are generally highest during November, as are corporate buybacks.
The first point is most important here, as the dynamic which has played a large part in driving the S&P 500 throughout 2023 has been the vast amount of volatility supply through record structured product issuance. This can be highlighted by examining fixed-strike volatility as a measure of implied volatility rather than the VIX, of which the former has been much less bid than the latter through October’s market weakness. This suggests market participants are not buying downside protection en masse as the market moves low, something which we would generally see during a full-blown market crash. Volatility supply under the hood remains, and as such, should help fuel a rally into year end when positive flows around volatility supply are at their highest.

Source: Bloomberg

Two: Seasonality is even more powerful following a weak October
These trends in seasonality are only exacerbated during years whereby October is a down month, with the average return over the preceding two months being 4.8% at an 88.9% hit rate.

Three: Buybacks
In addition to these structural flows around seasonality, November through December also sees what is generally the highest level of corporate buyback activity for the year. And, more importantly, the earnings blackout period whereby buybacks can resume post-earnings season is estimated by Goldman Sachs to be 70% open come the end of this week.

Source: Goldman Sachs
Four: Sentiment washout
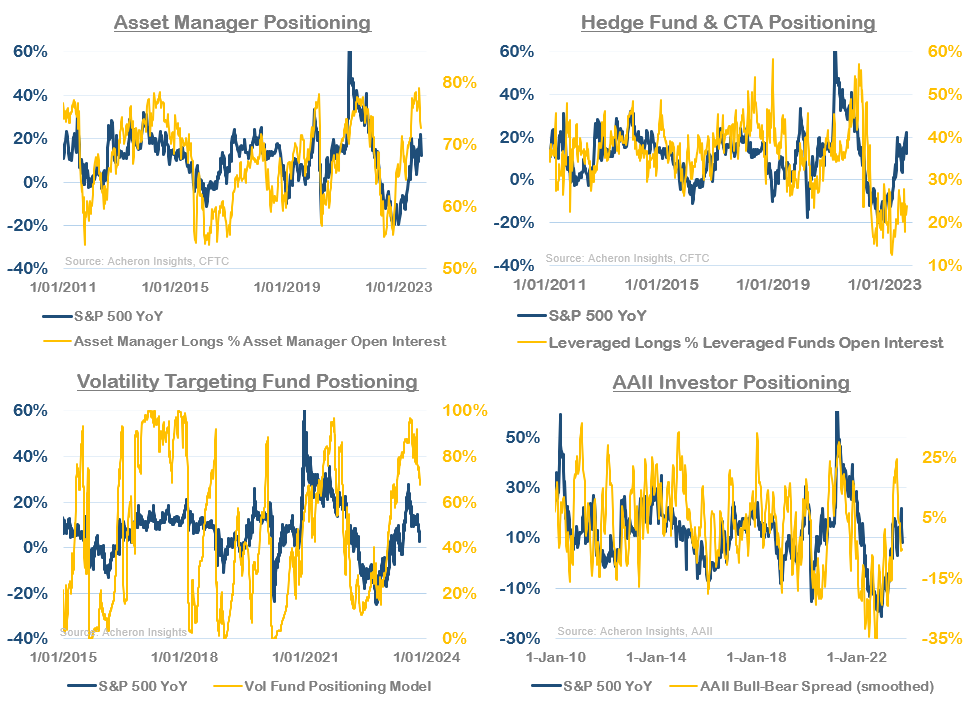
What is also relatively encouraging is the washout in positive sentiment we have seen over the past couple of months. The AAII Investor Positioning survey is back into neutral territory while the NAAIM Investor Positioning survey looks to be nearing contrarian levels.

Five: Positioning washout
In addition to sentiment, investor positioning is now much more constructive than it was a month ago. Asset managers and vol targeting funds have reduced their long positions from extreme levels by my calculations (though are still relatively long the market), while hedge funds and CTA’s remain massively underweight equities.
Six: Upside CTA asymmetry
It is the latter two categories by which the spark to fuel a year-end rally resides. CTA positioning is now dramatically skewed to the upside, with Goldman Sachs estimating these systematic funds will be net buyers of stocks under all market scenarios over the next month.
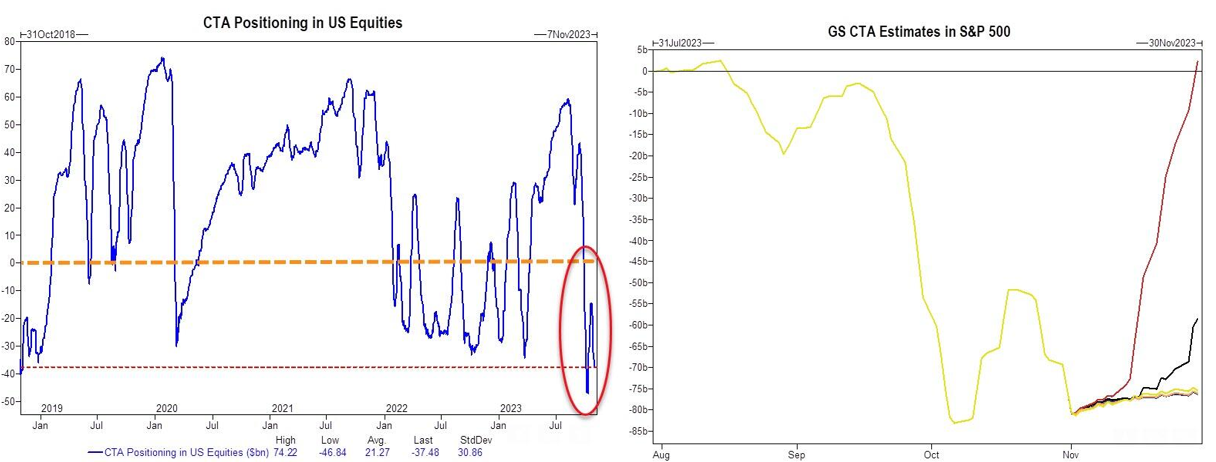
Source: Goldman Sachs
Seven: Upside hedge fund asymmetry
Meanwhile, hedge funds are now effectively the most underweight (and/or short) the market they have been since the GFC. Any kind rally could spark a meaningful short-squeeze from hedge funds.

Eight: Reprieve from the Treasury
An additional dynamic which I view as bullish on the margin is the change in composition of the Treasury’s debt issuance for Q4 of this year. This week’s Treasury Refunding Announcement highlighted how the Treasury plans to issue a larger number of shorter-duration debt securities as opposed to long-duration bonds, in addition to revising their Q4 issuance lower by $80 billion.
This should help provide some short-term reprieve for long-term interest rates as well as encouraging money market funds to absorb some of the T-Bill issuance via their funds parked at the Fed’s reverse repo facility, thus helping to offset the negative net-liquidity implications associated with debt issuance. We saw the Treasury makes similar moves in the first half of this year, allowing the market to absorb the record levels of government debt issuance with a much smaller impact on financial markets.

Treasury issuance by duration. Source: Treasury
Nine: CTA’s are bond buyers
In addition to being buyers of equities over the coming month, Goldman Sachs estimates CTA’s will also be significant buyers of bonds under all market scenarios in the coming weeks. Again, this should help ease the pressure on rates, if only for a short while.
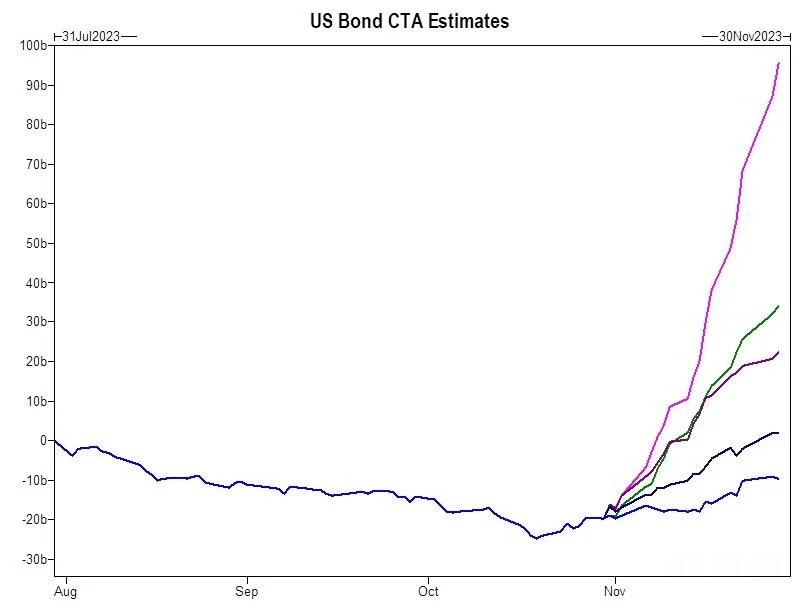
Source: Goldman Sachs
Ten: Bull flag?
The technical picture for the S&P 500 is an interesting one at present. Bulls could make the argument price action since mid-year is reflective on a bull flag technical pattern, a textbook corrective pattern which precedes further upside gains. What’s more, one could also argue we saw a false breakdown below the 4,200 support level, with such price action generally considered bullish, particularly on the back of a daily 9-13-9 DeMark sequential buy signal that was just triggered.
On the other hand, bears could point to the fact we are seeing a series a lower highs and lower lows, and have lost the 200-day moving average. It seems the 4,200 level is key for both bulls and bears.

Eleven: Mixed signals from market internals
While my bias is more bullish than bearish (if only slightly) to close out the year, from a market internals perspective there isn’t really any clear signal for either direction at present. While, the cyclicals/defensives ratio and credit spreads are holding up well, the VIX term structure and high beta/low beta ratio are both very much trading worse than the broad market. I would like to see the latter metrics trade a little better in the coming weeks in order to confirm by bullish thesis.

Twelve: Cyclical stocks continue to trade poorly
In terms of the relative performance of the most cyclical areas on the S&P 500 relative to the broad market (an important measure of market internals to which I also pay great attention), the message here is much less positive. As we can see below, we have had very poor participation from the Transports, Consumer Discretionary and Industrials industries of late. To me, this highlights how bad the underlying fundamentals are at present, and, should we indeed see a rally in the indices through year end, it is likely to be short lived as the macro, credit and liquidity environments remain unfavourable to risk-assets over the medium-term.

. . .
Thanks for reading.